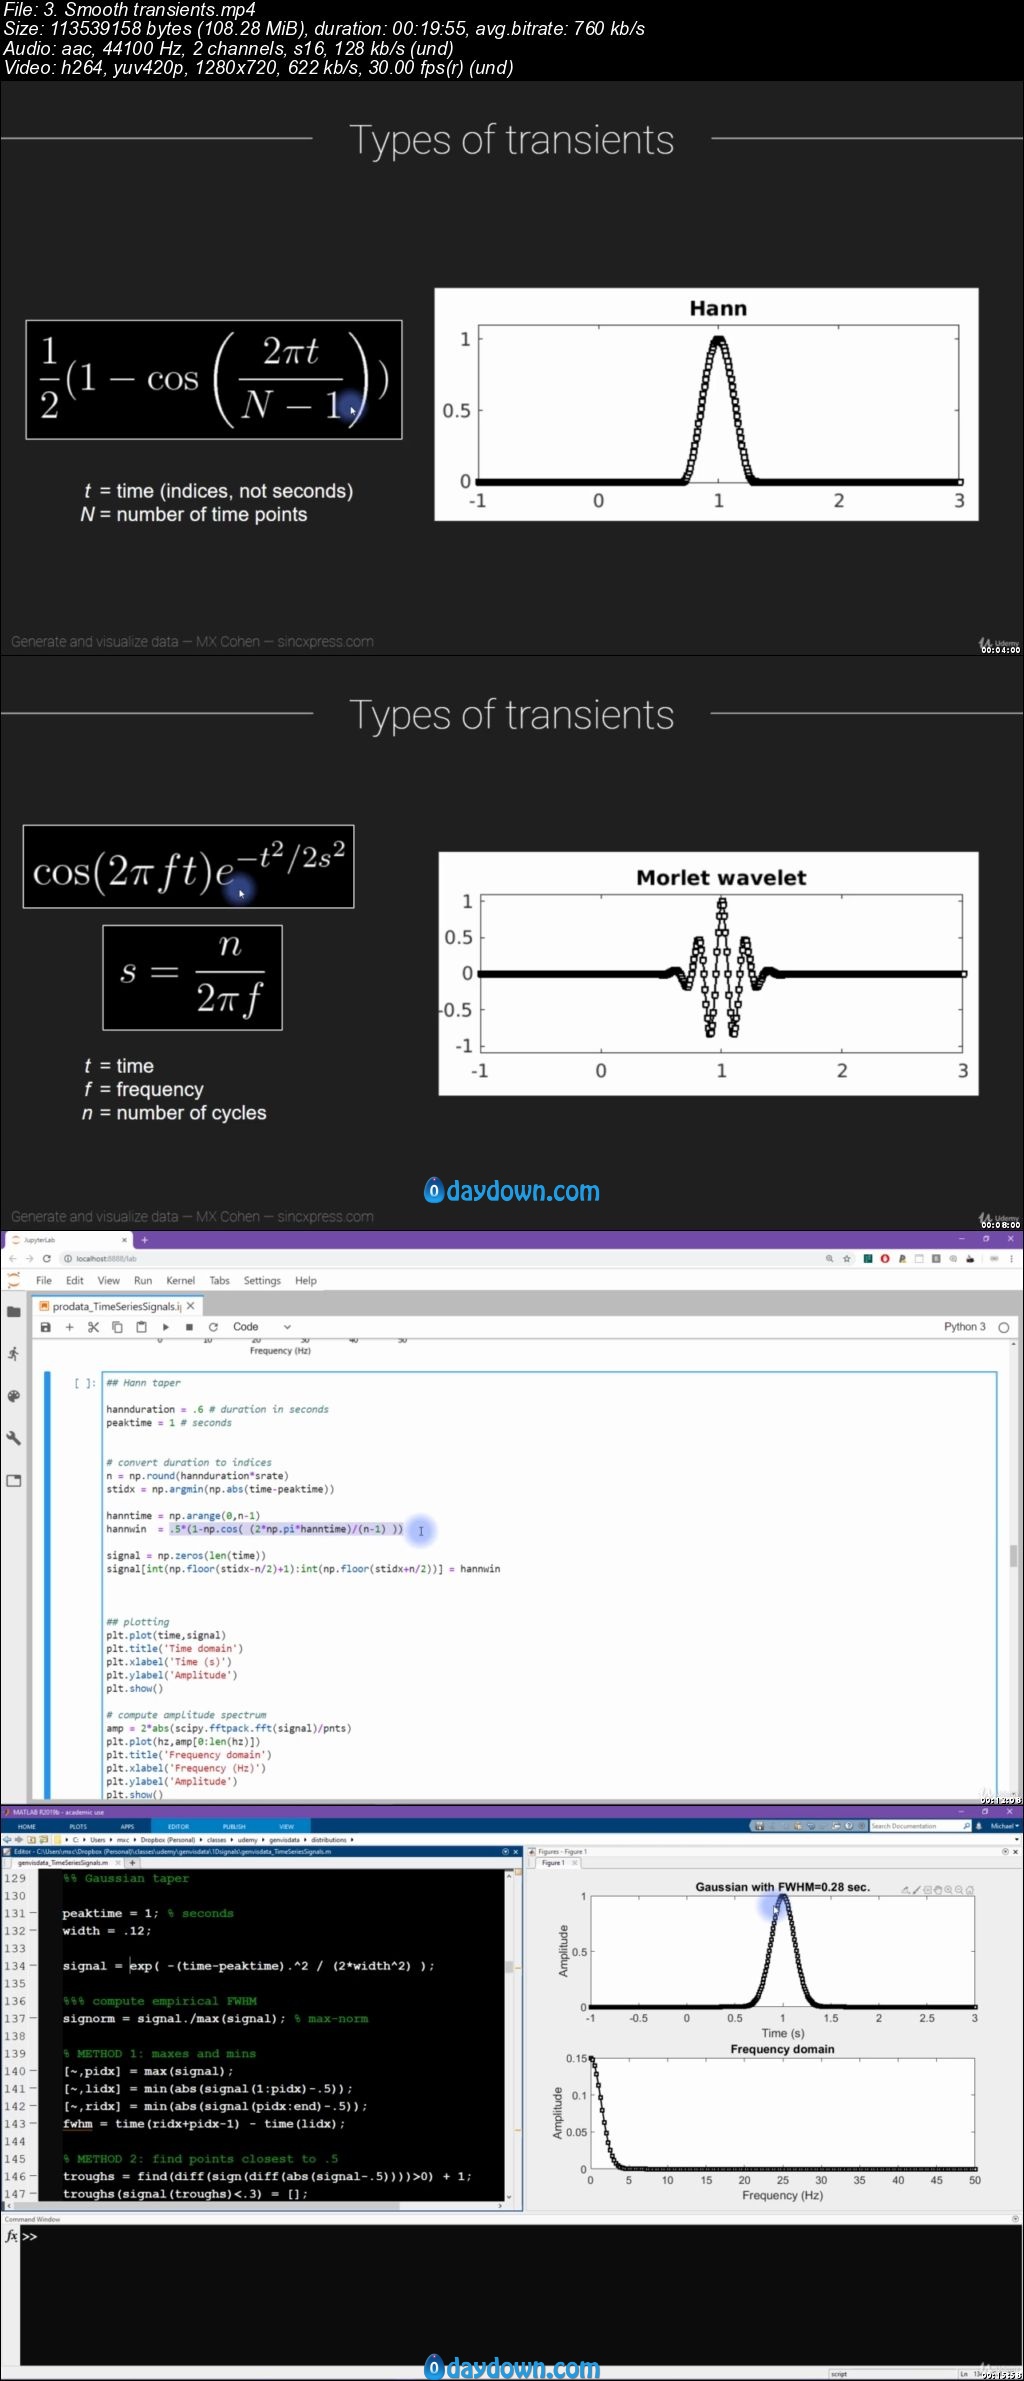
Video: .mp4 (1280×720, 30 fps(r)) | Audio: aac, 44.1 KHz, 2 Ch
Genre: eLearning Video | Language: English + .srt | Duration: 6.5 hour | Size: 2.2 GB
Learn how to simulate and visualize data for data science, statistics, and machine learning in MATLAB and Python
What you’ll learn
Understand different categories of data
Generate various datasets and modify them with parameters
Visualize data using a multitude of techniques
Generate data from distributions, trigonometric functions, and images
Understand forward models and how to use them to generate data
Improve MATLAB and Python programming skills
Requirements
Interest in data
High-school math
Basic programming familiarity (MATLAB or Python)
Familiarity with power spectra from the Fourier transform
Description
Data science is quickly becoming one of the most important skills in industry, academia, marketing, and science. Most data-science courses teach analysis methods, but there are many methods; which method do you use for which data? The answer to that question comes from understanding data. That is the focus of this course.
What you will learn in this course:
You will learn how to generate data from the most commonly used data categories for statistics, machine learning, classification, and clustering, using models, equations, and parameters. This includes distributions, time series, images, clusters, and more. You will also learn how to visualize data in 1D, 2D, and 3D.
All videos come with MATLAB and Python code for you to learn from and adapt!
This course is for you if you are an aspiring or established:
Data scientist
Statistician
Computer scientist (MATLAB and/or Python)
Signal processor or image processor
Biologist
Engineer
Student
Curious independent learner!
What you get in this course:
>6 hours of video lectures that include explanations, pictures, and diagrams
pdf readers with important notes and explanations
Exercises and their solutions
MATLAB code and Python code
With >4000 lines of MATLAB and Python code, this course is also a great way to improve your programming skills, particularly in the context of data analysis, statistics, and machine learning.
What do you need to know before taking this course?
You need some experience with either Python or MATLAB programming. You don’t need to be an expert coder, but if you are comfortable working with variables, for-loops, and basic plotting, then you already know enough to take this course!
Who this course is for:
Data scientists who want to learn how to generate data
Statisticians who want to evaluate and validate methods
Someone who wants to improve their MATLAB skills
Someone who wants to improve their Python skills
Scientists who want a better understanding of data characteristics
Someone looking for tools to better understand data
Anyone who wants to learn how to visualize data
Password/解压密码-0daydown
Download rapidgator
https://rg.to/file/d1911024d9be706d595a1770c06b1155/Generate_and_visualize_data_in_Python_and_MATLAB.part1.rar.html
https://rg.to/file/cc7b0ef84a5ce70eddd4d5bfe7e8feee/Generate_and_visualize_data_in_Python_and_MATLAB.part2.rar.html
https://rg.to/file/be59ba9171ae939201eb0125cb6644b6/Generate_and_visualize_data_in_Python_and_MATLAB.part3.rar.html
Download nitroflare
https://nitroflare.com/view/75A5D8C0CC48F34/Generate_and_visualize_data_in_Python_and_MATLAB.part1.rar
https://nitroflare.com/view/698732778868026/Generate_and_visualize_data_in_Python_and_MATLAB.part2.rar
https://nitroflare.com/view/3BE692A6EFB44E4/Generate_and_visualize_data_in_Python_and_MATLAB.part3.rar
Download 百度云
你是VIP 1个月(1 month)赞助会员,
转载请注明:0daytown » Generate and visualize data in Python and MATLAB
