Duration 1h 22m Project Files Included MP4
Creating and Stylizing Statistical Information in Illustrator
Info:
In this Illustrator tutorial, we’ll be using graphs and charts to visualize data and learning how we can customize them to make them more appealing.
We’ll start by getting familiar with a pie graph and learn how we can enter data into the worksheet to see results in our graph. We’ll then move onto column and area graphs and learn what a data set is and how to translate it into our graphs.
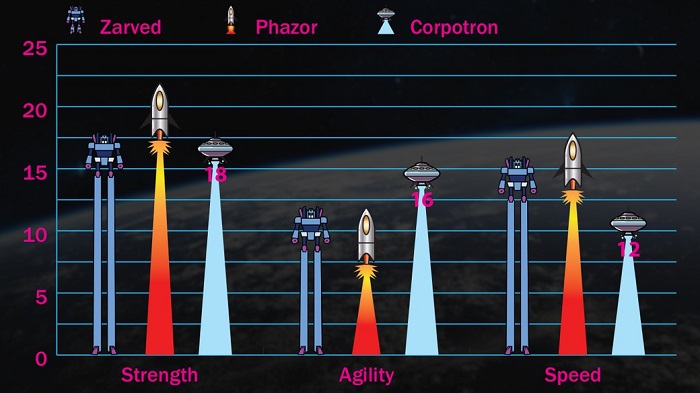
Next, we’ll learn how to get our graph’s legends and labels to look intentional. We’ll also combine different graph types in the same visualization and learn how to format color and type for our graph.
We’ll wrap up this tutorial by learning how to use graphics in place of columns, markers in our graphs and how we can customize the appearance of our graphics to get the best result.
By the end of this Illustrator training, you’ll have a variety of tips and tricks under your belt for the next time you need to add great-looking graphs in your designs.
Download uploaded
http://uploaded.net/file/t4pmpp5f/DTCreStyliStatInfoIllustrator.part1.rar
http://uploaded.net/file/wftyk8qb/DTCreStyliStatInfoIllustrator.part2.rar
http://uploaded.net/file/tqzn55ii/DTCreStyliStatInfoIllustrator.part3.rar
Download nitroflare
http://www.nitroflare.com/view/473936BC17FF238/DTCreStyliStatInfoIllustrator.part1.rar
http://www.nitroflare.com/view/363D24122B79875/DTCreStyliStatInfoIllustrator.part2.rar
http://www.nitroflare.com/view/A2E52513A707F0F/DTCreStyliStatInfoIllustrator.part3.rar
Download 百度云
链接: http://pan.baidu.com/s/1hqpqUgO 密码: jmu3
转载请注明:0daytown » Creating and Stylizing Statistical Information in Illustrator