调试和监控TensorFlow程序
本教程会深入学习Tensorflow工具箱中的两个特别的工具:tfdbg和TensorBoard。这些工具可以被用来检视Tensorflow程序的内部状态,以及可视化执行标准和状态。
开发出色的ML模型的一个重要方面,是当你的模型没有汇聚的情况下能够调试Tensorflow代码。传统的调试者缺乏这方面的技能,这也是为何tfdbg和TensorBoard在你的功能箱中是重要的技能的原因。在本教程中,你将学习如何适应TensorFlow命令行和类库函数,用以帮助你调试程序以及学习如tfdbg和Tensorboard这样特别的工具。首先,你将了解TensorFlow调试代码的特别功能。tf.Print() 和 tf.Assert()语句,传统的Python调试者和tf.py_fun()解析混乱的Python代码成为计算图像,这可以帮助来调试图像构建阶段。接下来,你将看到特别的调试器tfdbg,其工作方式与传统的Python调试很类似,但却具有但步执行session.run()语句和在每一步显示计算图像状态的功能。其还可以筛选如has_inf_or_nan,这可以让你在你的模型开始汇聚之处插入准确的点。最后,你将学习TensorBoard,这是一款基于浏览器的功能,可以帮助你可视化计算图像,以及查看流程是如何控制你的代码的。另外,其还可以被用作显示执行标准和目前的程序状态。在学习完本教程,通过掌握重要的开发和调试强壮的机器学习模型,你将更接近掌握TensorFlow。
MP4 | Video: AVC 1280×720 | Audio: AAC 44KHz 2ch | Duration: 2 Hours 17M | 339 MB
Genre: eLearning | Language: English
This course goes deep into two specific tools in the TensorFlow toolkit – tfdbg and TensorBoard. These tools can be used to examine the internal state of TensorFlow programs and to visualize execution metrics and state.
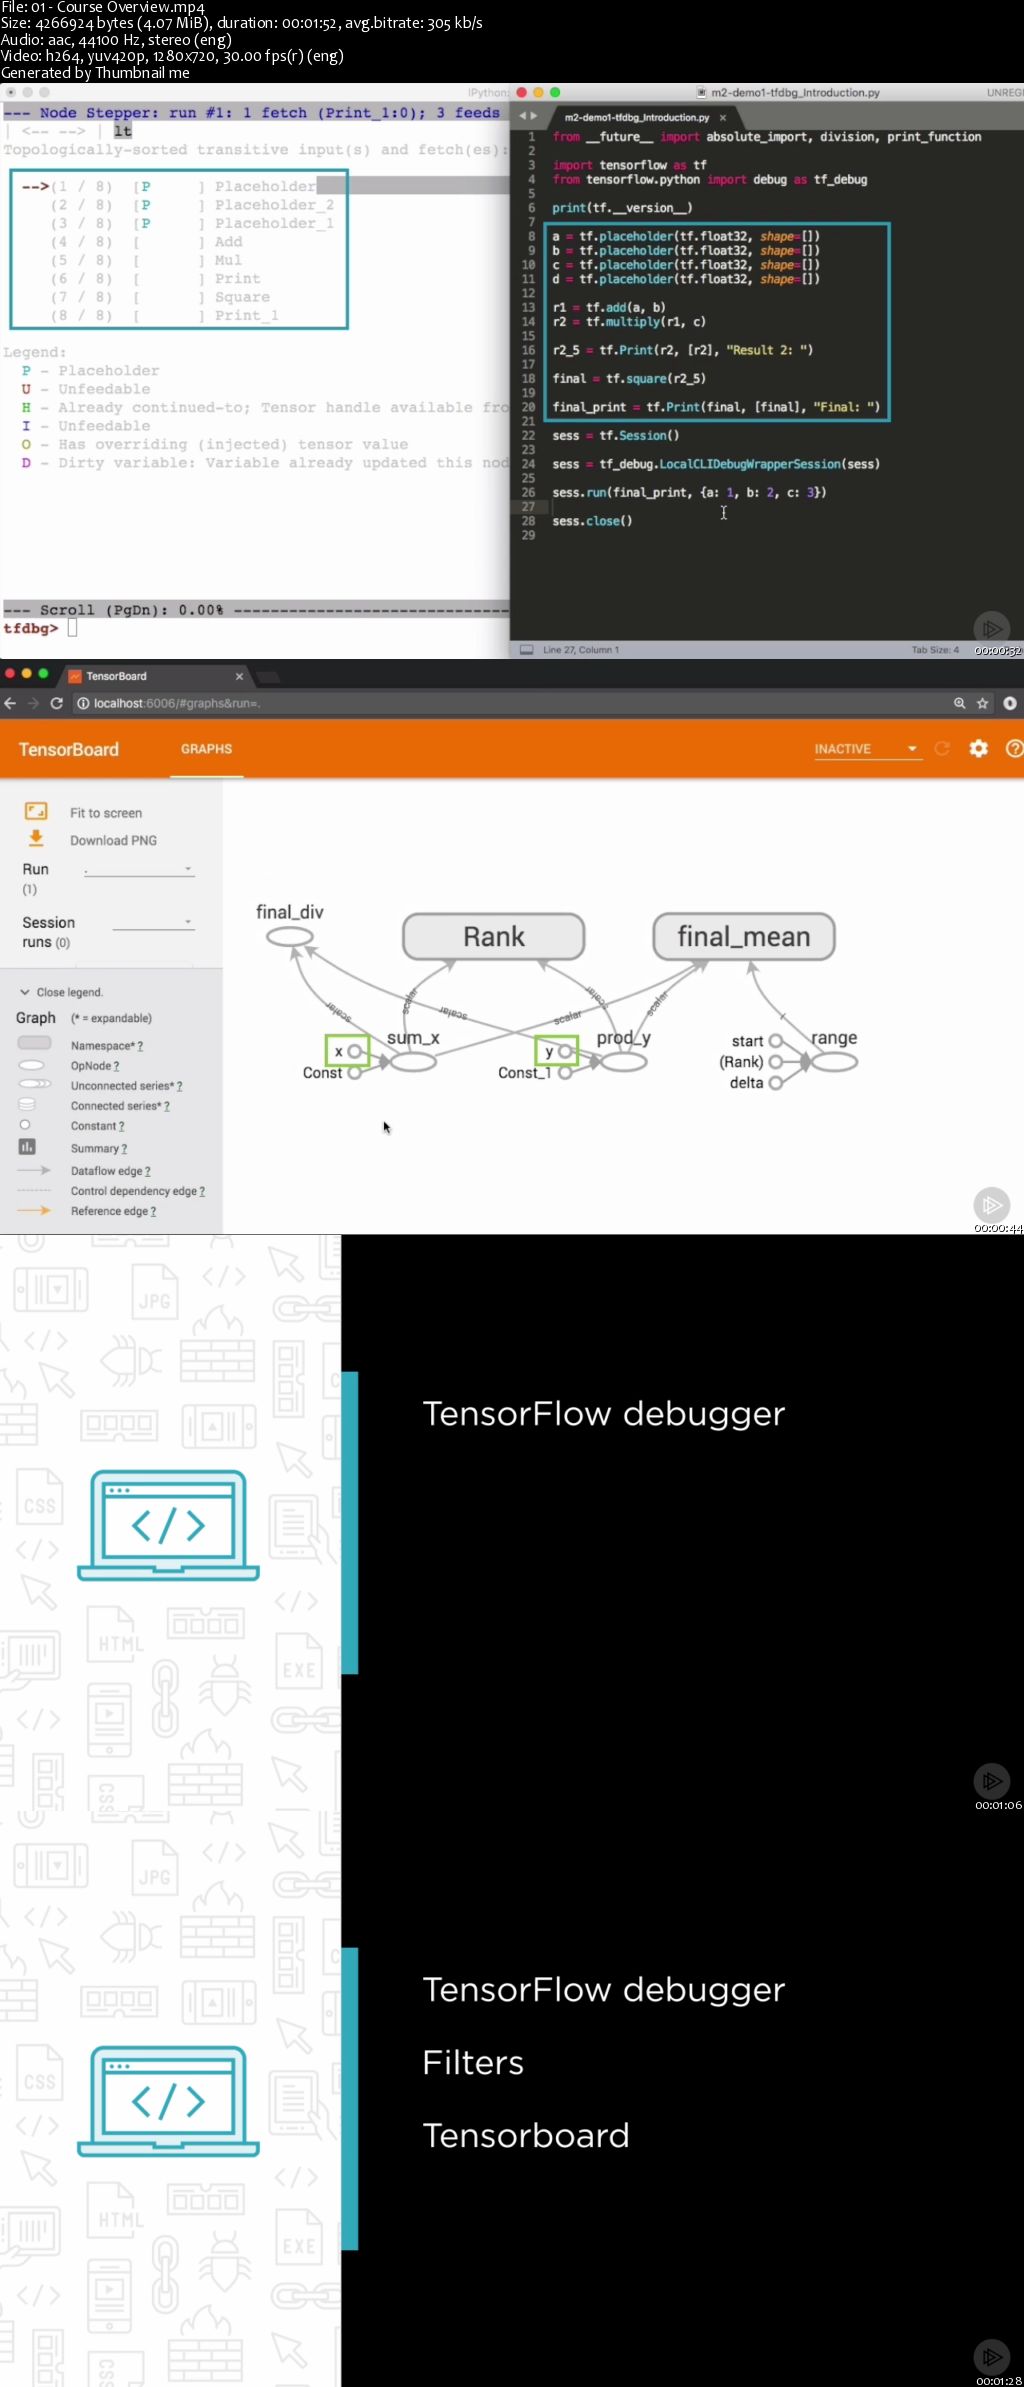
An important facet of building good ML models is the ability to debug TensorFlow code when your models do not converge. Traditional debuggers fall short in this regard which is why tfdbg and TensorBoard are important skills in your toolkit. In this course, Debugging and Monitoring TensorFlow Programs, you will learn how you can adapt TensorFlow commands and library functions to help debug your programs in addition to learning specialized tools like tfdbg and Tensorboard. First, you will go over TensorFlow’s special features to debug your code. Partial graph executions, tf.Print() and tf.Assert() statements, traditional Python debuggers and the tf.py_func() to interpose arbitrary Python code into your computation graph all help debug the graph build phase. Next, you will see that the specialized TensorFlow debugger tfdbg works very much like traditional Python debuggers but has the ability to step into session.run() statements and display the state of your computation graph at every step. It also has filters like the has_inf_or_nan which allows you to break at the exact point your model begins to diverge. Finally, you will be shown Tensorboard, which is a browser-based tool that helps you visualize your computation graph and view how control flows through your code. In addition, it can be used to display execution metrics and the current state of your program. After finishing this course, you will be closer to mastering TensorFlow through equipping you with important tools to build and debug robust machine learning models.

Password/解压密码-0daydown
Download rapidgator
https://rg.to/file/2de1c8bad0a317625aed6db74468426b/DMTF.rar.html
Download nitroflare
http://nitroflare.com/view/C605B86A69A44BC/DMTF.rar
Download 百度云(2018/7/29更新)
你是VIP 1个月(1 month)赞助会员,
转载请注明:0daytown » Debugging and Monitoring TensorFlow Programs