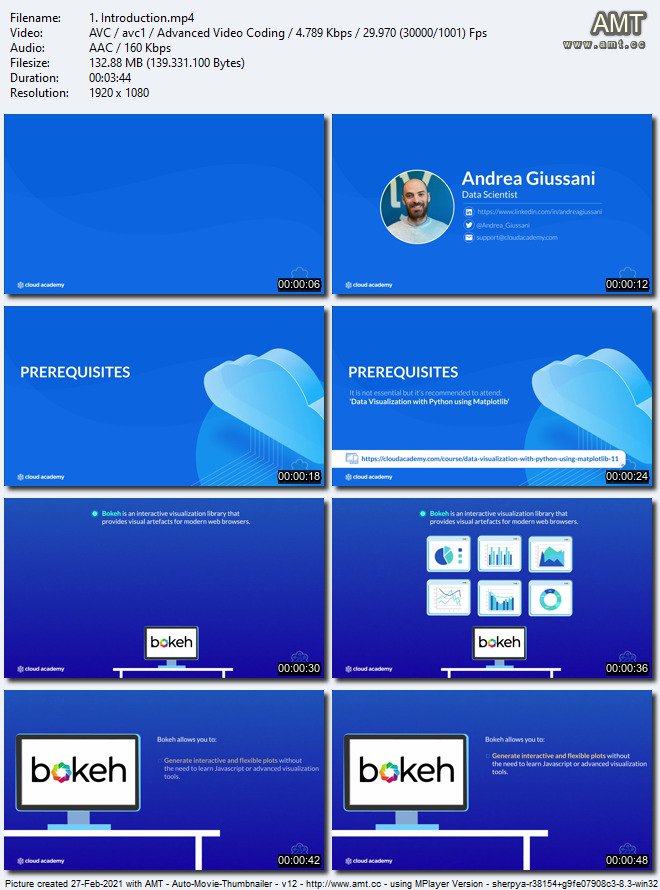
 MP4 | Video: h264, 1920×1080 | Audio: AAC, 44.1 KHz, 2 Ch
Difficulty: Intermediate | Genre: eLearning | Language: English | Duration: 7 Lectures (1h 13m) | Size: 870.6 MB
Description
Bokeh is an interactive visualization library in Python that provides visual artefacts for modern web browsers. In this course, we’re going to have a look at the fundamental tools that are necessary to build interactive plots in Python using Bokeh.
Bokeh exposes two interface levels to users: bokeh.plotting and bokeh.models, and this course will focus mainly on the bokeh.plotting interface.
We’ll start things off by exploring two key concepts in Bokeh: Column Data Source and Glyphs. Then we’ll move on to looking at different aspects related to the customization of a bokeh plot, as well as focusing on how to introduce interactivity into a Bokeh object.
You’ll also learn about using inspectors to report information about the plot and we’ll also investigate different ways to plot multiple Bokeh objects in one figure. We’ll round off the course by looking at plot methods for categorical variables.
Learning Objectives
Learn about Columns Data Sources and Glyphs in Bokeh and how they are used
Learn how to customize your plots and add interactivity to them
Understand how inspectors can be added to plots to provide additional information
Learn how to plot multiple Bokeh objects in one figure
Understand the plot methods available for categorical variables
Intended Audience
Data scientists
Anyone looking to build interactive plots in Python using Bokeh
Prerequisites
To get the most out of this course, you should have a good understanding of Python. Before taking this course, we also recommend taking our Data Visualization with Python using Matplotlib course.
Resources
The GitHub repo for this course can be found here: https://github.com/cloudacademy/interactive-data-visualization-with-bokeh

Password/解压密码0daydown
Download rapidgator
https://rg.to/file/1baf0a52cfbe264ea6853b2598ac60ad/Interactive_Data_Visualization_with_Python_using_Bokeh.part1.rar.html
https://rg.to/file/36e999eb16f91c53ca931fe1a4c2af95/Interactive_Data_Visualization_with_Python_using_Bokeh.part2.rar.html
Download nitroflare
https://nitroflare.com/view/BEEBD37E686E826/Interactive_Data_Visualization_with_Python_using_Bokeh.part1.rar
https://nitroflare.com/view/21E4DD73399D838/Interactive_Data_Visualization_with_Python_using_Bokeh.part2.rar
转载请注明:0daytown » Interactive Data Visualization with Python using Bokeh