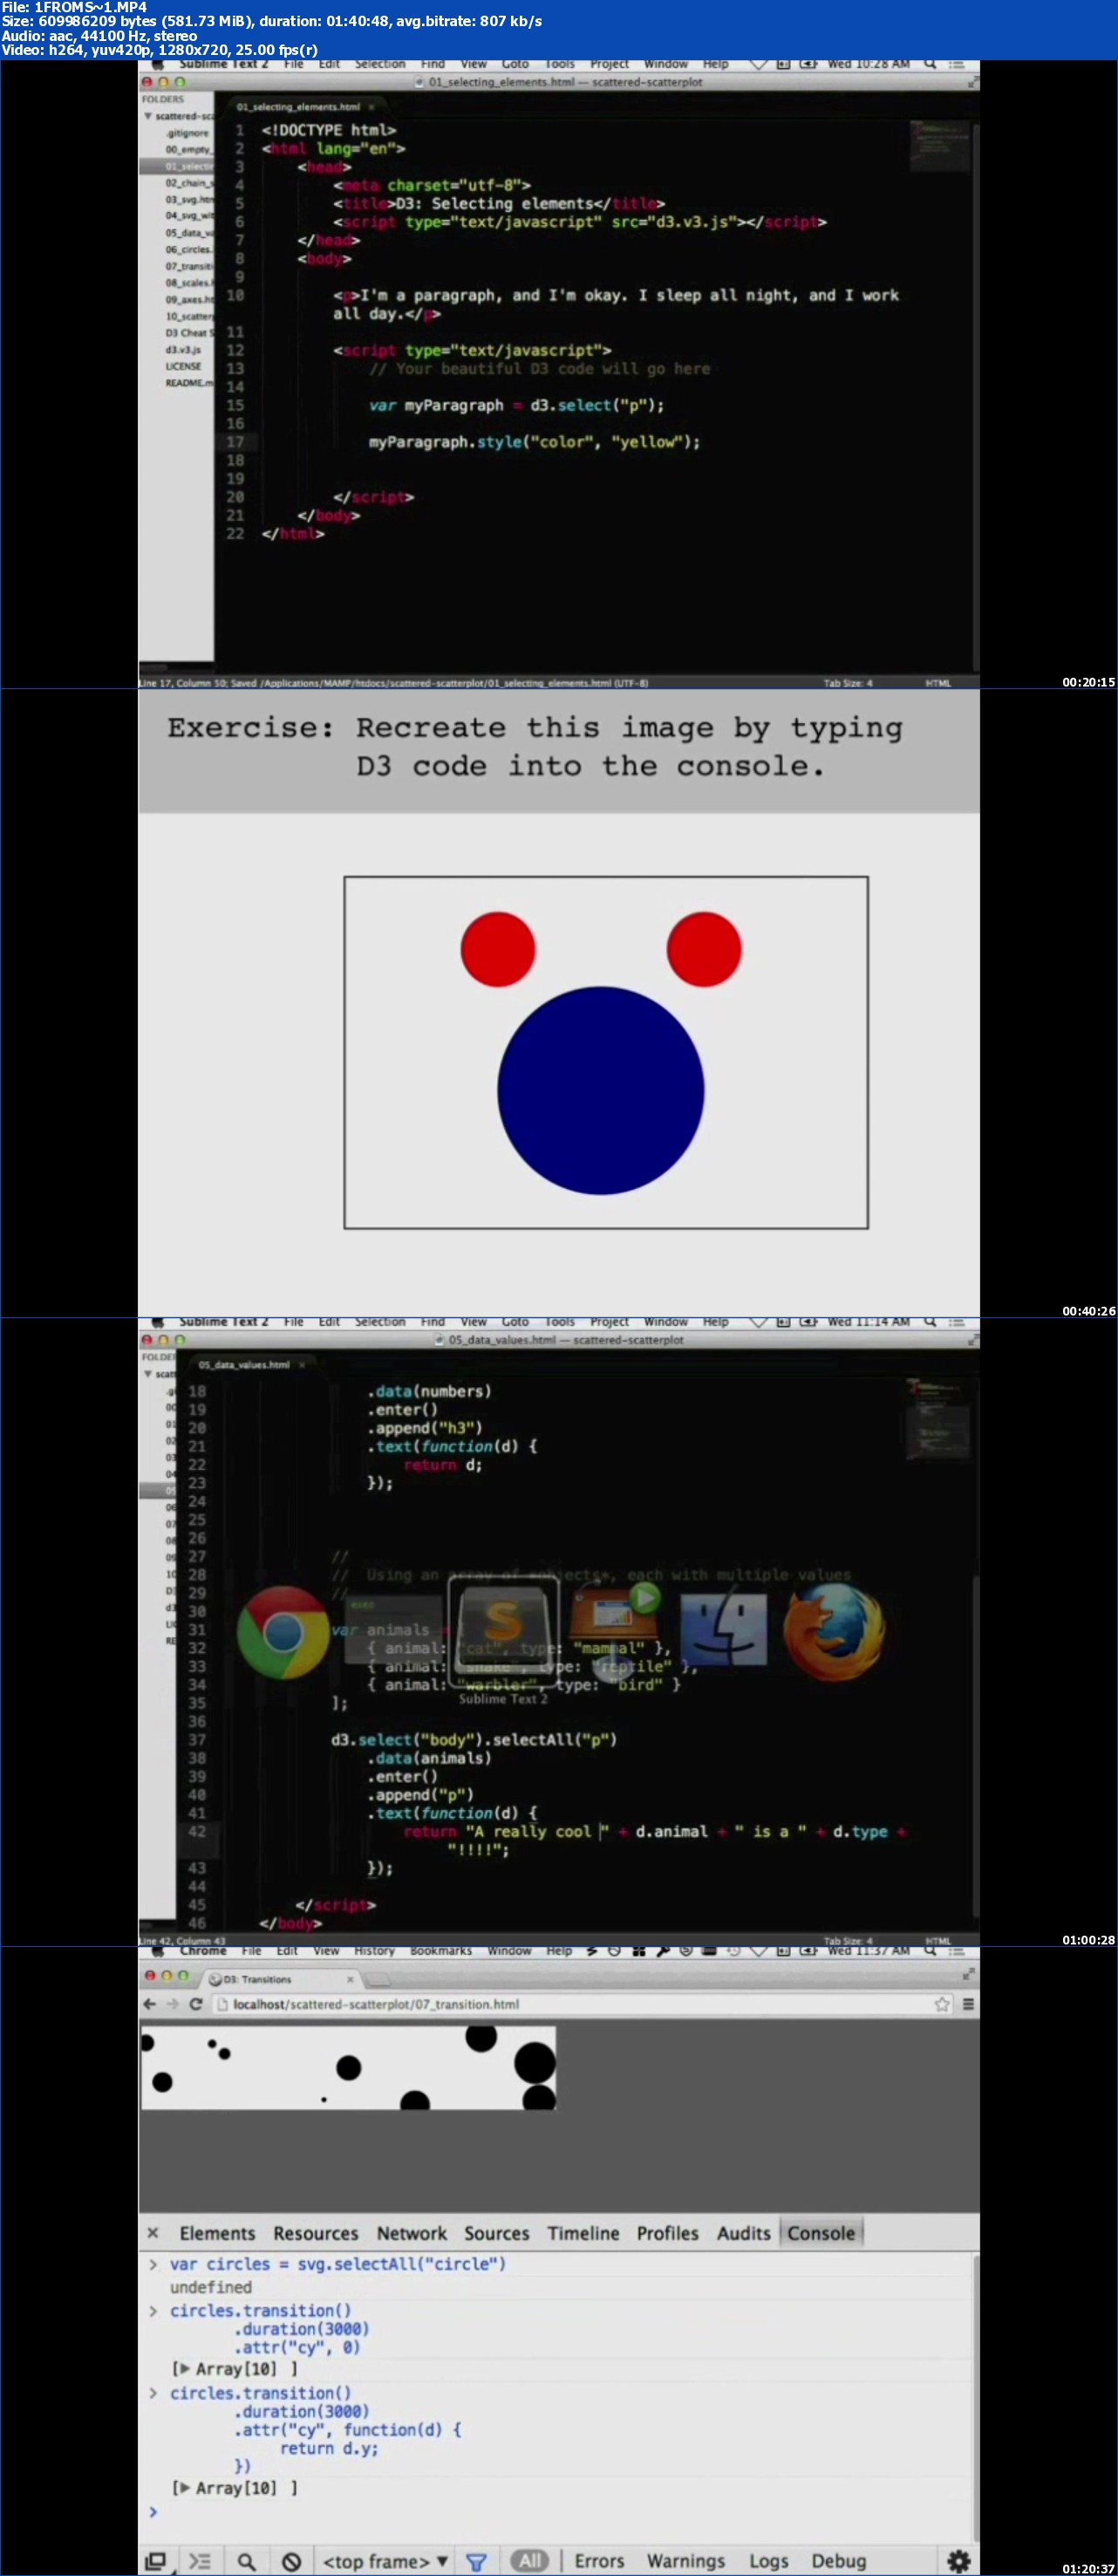
Oreilly – From Scattered to Scatterplot in Less Than 2 Hours
English | .MP4 | AAC LC 2 channels 44.1 KHz | AVC [email protected] 1280×720 pixels 25.000 fps @ 807 Kbps | 581.73MB
Genre: E-learning
Confused by D3? Interested in coding data visualizations on the web but don’t know where to start? This online tutorial will have you transforming data into visual images in no time at all starting from scratch and building an interactive scatterplot by the end of the session. We’ll use d3.js the web’s most powerful library for data visualization to load data and translate values into SVG elements – drawing lines points and scaled axes to label our data.

Download rapidgator
http://rg.to/file/f92a245d2520dce51afebbf97eaa846f/P114_From_Scattered_to_Scatterplot_in_Less_Than_2_Hours.part1.rar.html
http://rg.to/file/9501f66050e32f342609fafc4d781853/P114_From_Scattered_to_Scatterplot_in_Less_Than_2_Hours.part2.rar.html
http://rg.to/file/f92a245d2520dce51afebbf97eaa846f/P114_From_Scattered_to_Scatterplot_in_Less_Than_2_Hours.part1.rar.html
http://rg.to/file/9501f66050e32f342609fafc4d781853/P114_From_Scattered_to_Scatterplot_in_Less_Than_2_Hours.part2.rar.html
Download uploaded
http://uploaded.net/file/cxycq497/P114_From_Scattered_to_Scatterplot_in_Less_Than_2_Hours.part1.rar
http://uploaded.net/file/pmailfml/P114_From_Scattered_to_Scatterplot_in_Less_Than_2_Hours.part2.rar
Download Firedrive and 百度云
你是VIP 1个月(1 month)赞助会员,
转载请注明:0daytown » Oreilly – From Scattered To Scatterplot In Less Than 2 Hours
与本文相关的文章
- Python 3 OOP: Master Python Object Oriented Programming
- Python for VLSI Engineer P2 : Understanding COCOTB
- Building Powerful AI Marketing Automation with OpenAI API
- Backend Systems Design
- AUTOSAR Application Software Layer Course (ASWL) | english
- Ultimate Lighting Course – In-Depth Tutorial
- Flutterflow: Le cours complet – Le no code iOS & Android
- Support Vector Machines in Python: SVM Concepts & Code
- Logistic Regression in Python
- RESTful API with Angular & Django: Learn CRUD & AUTH
- Machine Learning Primer with JS: Regression (Math + Code)
- Create Desktop Game For Beginner with Unity Engine & C#