Livelessons – Statistical Analysis Using Excel (Video Training) Volume II
English | .MP4 | Included Working Files | AAC LC, 2 channels, 44.1 KHz | AVC [email protected], 1152×720 pixels, 25.000 fps @ 254 Kbps | 1.081GBGenre: E-learning
Statistical Analysis Using Excel Volume II LiveLessons provides over 9 hours of video instruction. Means, medians and modes are one thing. Multiple regression analysis is quite another! These training videos bring it into focus.
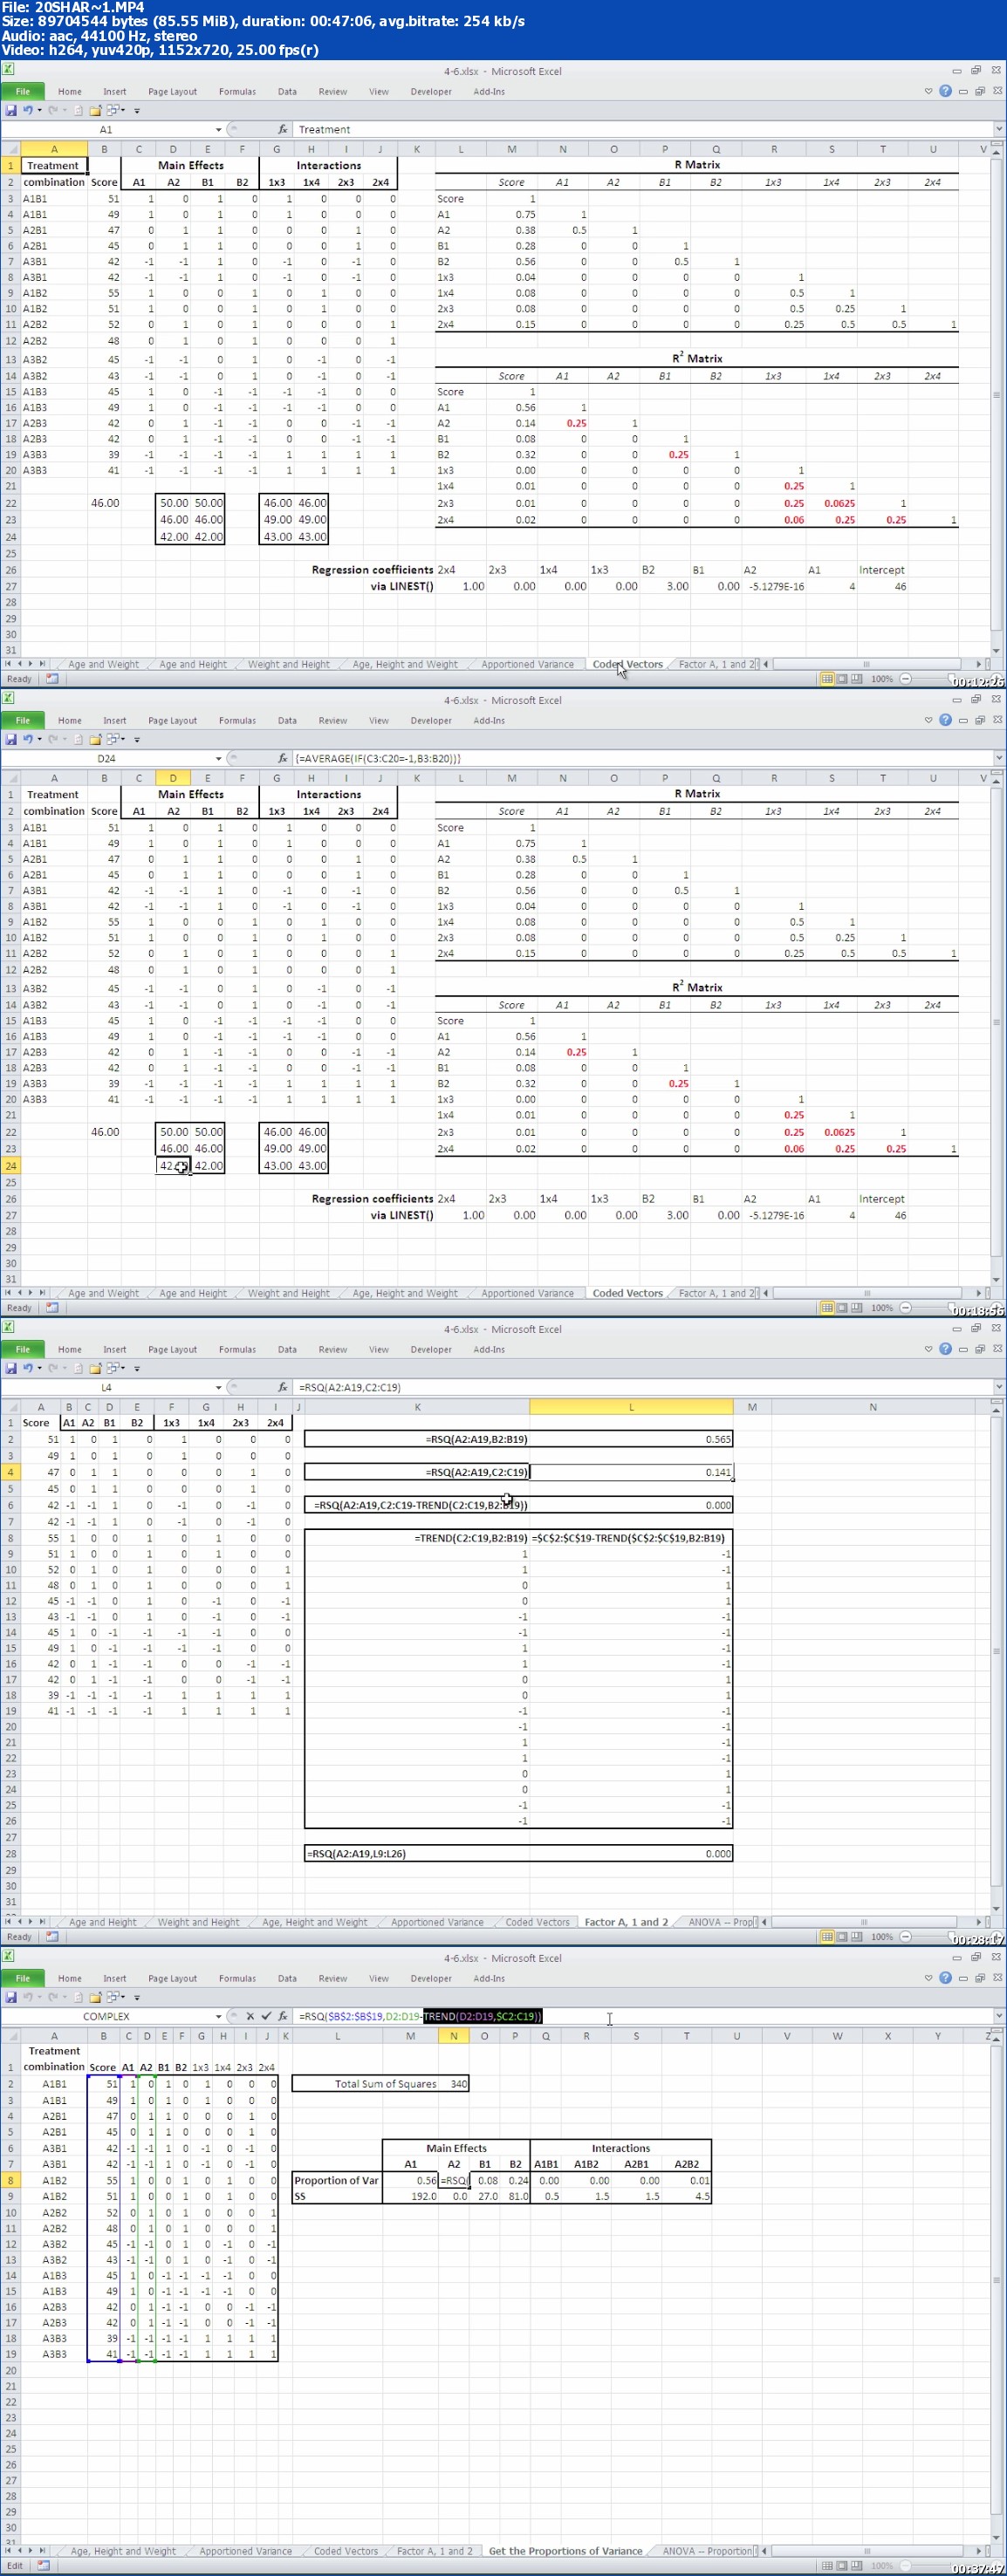
Bestselling author and experienced consultant Conrad Carlberg provides the novice with 9+ hours of hands-on step-by-step video training on the intricacies that comprise statistical analysis. This Volume II series moves from the basics to intermediate applications and how Excel supports them: for example, the Analysis of Variance (ANOVA) and how it’s supported simplistically by the Data Analysis add-in, and more powerfully by worksheet functions such as LINEST and by the combination of effect coding with Excel’s lookup functions. This volume concludes with discussions and demonstrations of more advanced techniques, showing how multiple regression combines with the General Linear Model to produce the analysis of covariance, and how Excel’s mixed referencing makes it easy to visualize what’s going on as new vectors enter an analysis.
Bestselling author and experienced consultant Conrad Carlberg provides the novice with 9+ hours of hands-on step-by-step video training on the intricacies that comprise statistical analysis. This Volume II series moves from the basics to intermediate applications and how Excel supports them: for example, the Analysis of Variance (ANOVA) and how it’s supported simplistically by the Data Analysis add-in, and more powerfully by worksheet functions such as LINEST and by the combination of effect coding with Excel’s lookup functions. This volume concludes with discussions and demonstrations of more advanced techniques, showing how multiple regression combines with the General Linear Model to produce the analysis of covariance, and how Excel’s mixed referencing makes it easy to visualize what’s going on as new vectors enter an analysis.

Password:www.0daydown.com
Download rapidgator
Download uploaded
Download 百度云
你是VIP 1个月(1 month)赞助会员,
转载请注明:0daytown » Livelessons – Statistical Analysis Using Excel (Video Training) Volume II
与本文相关的文章
- Python 3 OOP: Master Python Object Oriented Programming
- Python for VLSI Engineer P2 : Understanding COCOTB
- Building Powerful AI Marketing Automation with OpenAI API
- Backend Systems Design
- AUTOSAR Application Software Layer Course (ASWL) | english
- Ultimate Lighting Course – In-Depth Tutorial
- Flutterflow: Le cours complet – Le no code iOS & Android
- Support Vector Machines in Python: SVM Concepts & Code
- Logistic Regression in Python
- RESTful API with Angular & Django: Learn CRUD & AUTH
- Machine Learning Primer with JS: Regression (Math + Code)
- Create Desktop Game For Beginner with Unity Engine & C#