Video: .MP4, AVC, 1920×1080, 30 fps | Audio: English, AAC, 44.1 KHz, 2 Ch | Duration: 3h 51m | 1.5 GB
Instructor: Elle Krout
In the DevOps Monitoring Deep Dive, we use Prometheus, Alertmanager, and Grafana to demonstrate monitoring concepts that we can use on any monitoring stack. We start by building a foundation of some general monitoring concepts, then get hands-on by working with common metrics across all levels of our platform.
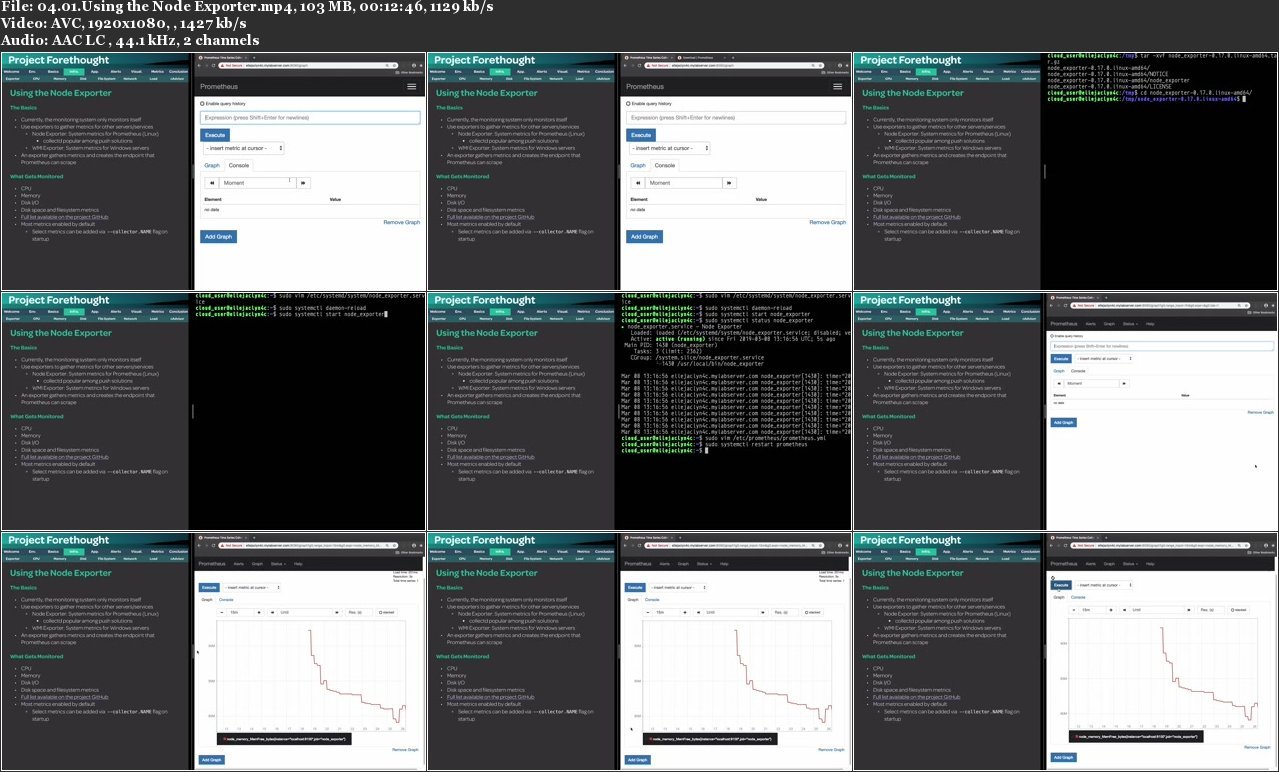
We’ll exploring infrastructure monitoring by using Prometheus’s Node Exporter and viewing statistic about our CPU, memory, disk, file system, basic networking, and load metrics. We’ll also take a look at how to monitor any contrainers we may be using on our virtual machine.
Once our infrastructure monitoring is up and running, we’ll take a look at a basic Node.js application and use a Prometheus client libary to track metrics across our application.
Finally, we look at how we can get the most out of our metrics by learning how to add recording and alerting rules, then building out a series of routes so any alerts we create can get to their desired endpoint. We’ll also look at creating persistent dashboards with Grafana and use its various graphing options to better track our data.

Password/解压密码0daydown
Download rapidgator
https://rg.to/file/69fd89ef5b051bf10d468ca57164eca7/DevOps.Monitoring.Deep.Dive.part1.rar.html
https://rg.to/file/dd4aa21c036573dfba086719b7b5bd02/DevOps.Monitoring.Deep.Dive.part2.rar.html
https://rg.to/file/8ff77e8e8dc7d3067bee8d81640097a6/DevOps.Monitoring.Deep.Dive.part3.rar.html
Download nitroflare
https://nitroflare.com/view/A8922E48AC66A29/DevOps.Monitoring.Deep.Dive.part1.rar
https://nitroflare.com/view/61F7B81BBE49871/DevOps.Monitoring.Deep.Dive.part2.rar
https://nitroflare.com/view/E0BD1ABAA2D0E93/DevOps.Monitoring.Deep.Dive.part3.rar
转载请注明:0daytown » DevOps Monitoring Deep Dive