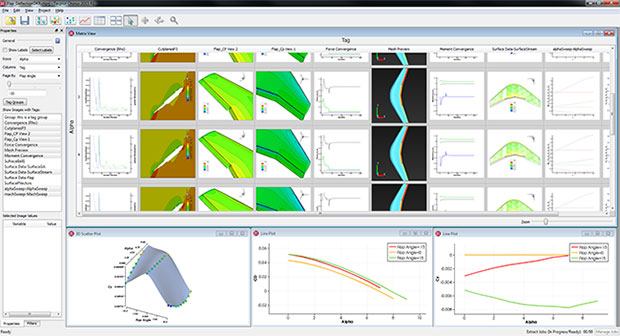
在CFD研究中,Tecplot Chorus使工程师能更加简单地发现趋势和异常情况,同时洞察引起这些变化的潜在的流动现象。
通过帮助工程师协作分析大量模拟数据,Tecplot Chorus将会有助于工程师更快地获得更加有信息的结果。
我们的用户多次向我们反应,他们有非常大量的数据要处理,并且没有工具能帮助他们快速地确认趋势和异常情况,这些可能会影响他们对关键设计所做出的决定。他们最担心的是错过一些重要的信息。Tecplot Chorus允许用户在一个参数空间内分析实验和模拟结果,以便更好地理解潜在的物理现象,最终做出更加科学的决定。
Tecplot Chorus可以同时轻松地分析处理1个乃至数千个的模拟案例。Tecplot Chorus为实验和数值计算数据集成了易于使用模拟数据管理系统。Tecplot Chorus也促进了在工程师队伍中巨大的合作和高效性,使他们能归档和分享模拟数据以避免重复工作。
Tecplot Chorus以灵活的特征集成了分析和质量确保过程,对大量的元数据进行管理、分析和可视化,以便确认趋势和异常情况,并且对潜在的物理现象连接他们。这一切将会产生更加快速的设计理念样本,以便在第一时间投入市场。
对经常操作和生成大量模拟或者实验数据的工程师来说Tecplot Chorus是非常有效的工具,常用于以下几个方面:
1、 优化一个设计方案
2、 深入研究一个工程问题
3、 Analyze the operational envelop of a configuration
在这三个应用方向中,工程师都需要管理数据,发现趋势和异常情况,并且理解引起这些变化的潜在的物理现象。这一个新的模拟分析工具能帮助工程师理解复杂性,分清趋势,并且关联这些与潜在物理现象,主要通过以下方法:
- 一个用于加强元数据和流场分析统一的环境
- 快速可视化和表面数据的研究
- 自动绘图和数据抽取
- 3D 后处理进程的开放性
- 替代模型工具(surrogate modeling tool)
- 易于设置和调度(easy set-up and deployment)
- Parametric CFD analysis
然而参数化分析如同产品自身分析一样古老,使其改变的在近些年中CFD的应用。今天,在参数分析中CFD正在担当着日益增长的地位。
- 参数分析的收益(Benefits of parametric analysis)
CIMdata Executive Consultant Ken Amann说“Tecplot Chorus是这些突破性技术中的一个,该技术能使广泛的CFD脚本协调工作。今天有很多具有不同水准的工程师咨询CFD研究,并且使他们协调工作,就应该给他们提供一个显著地高水平的观察和更快地做出更有信息的结果的能力”。
Tecplot Chorus 2015 R2 | 471.0 mb
Tecplot Chorus helps engineers who run many simulation or test data sets. Three common applications are optimizing designs, predicting performance over the operating envelope, and investigating engineering problems.In all three scenarios engineers and scientists need to manage data sets, discover trends and anomalies, and understand the underlying physics that cause variations.
Features
Fast Physics Exploration and Visualization
Tecplot Chorus integrates visualization, analysis, and parametric data managment in a unified environment. Try Tecplot Chorus for Free
Pre-compute plots to rapidly analyze full sets of simulation cases.
Quickly view plot images and solution data from the flow field with a single click.
Explore and filter an array of plots images.
Explore the full 3D flow field with slices, streamtraces, and iso-surfaces.
Analytics and Surrogate Modeling
Create multi-dimensional surrogate models.
Visualize multiple views of CFD results and flow field physics in one unified environment.
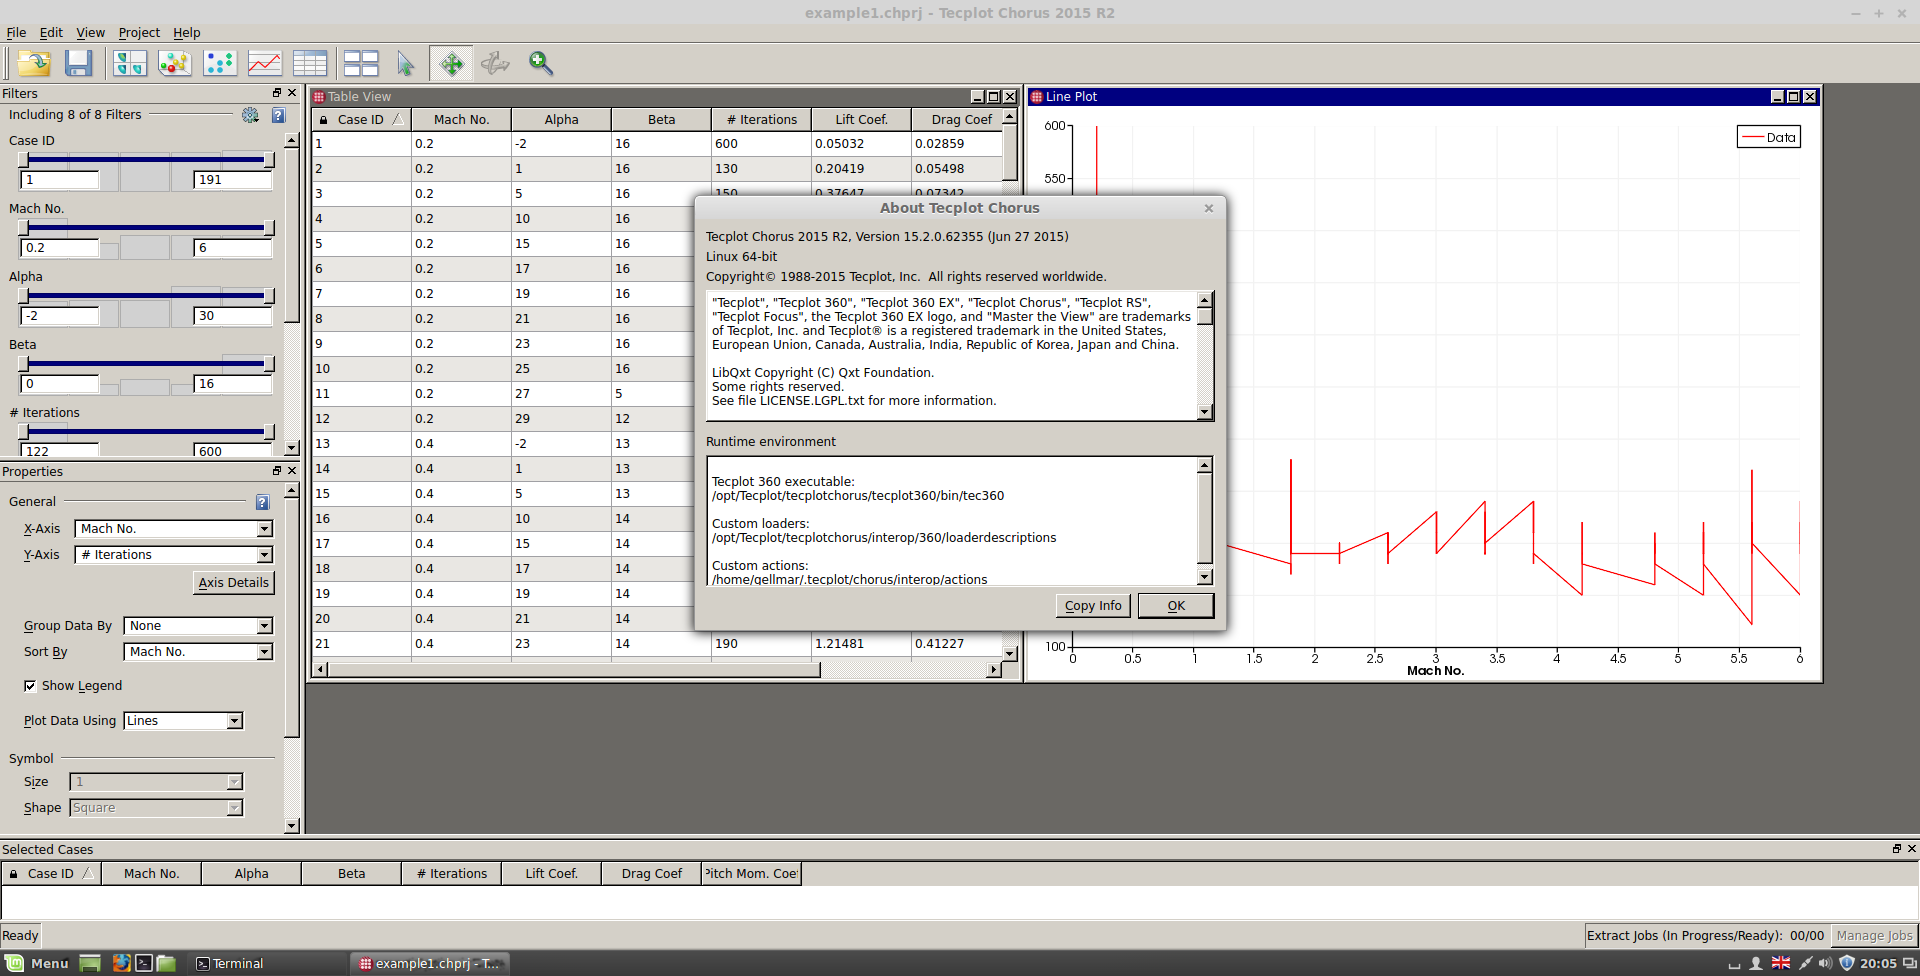
Explore project results with linked table, XY and multi-dimensional scatter views.
Comparative Analysis of Field Data
Compare selected plot images and field data plots in n-by-n matrices or side-by-side views.
Compare pixel-by-pixel differences for selected plots.
Calculate differences between field variables on a grid for selected cases.
Home Page – http://www.tecplot.com/
Download uploaded
http://uploaded.net/file/wkkv30on/loTeCh15R2_Linux.rar
http://uploaded.net/file/qk9wdo5d/loTeCh15R2_Windows.rar
Download nitroflare
http://www.nitroflare.com/view/E75D55E5F5A8662/loTeCh15R2_Linux.rar
http://www.nitroflare.com/view/9A3A05F33847492/loTeCh15R2_Windows.rar
Download 百度云
你是VIP 1个月(1 month)赞助会员,