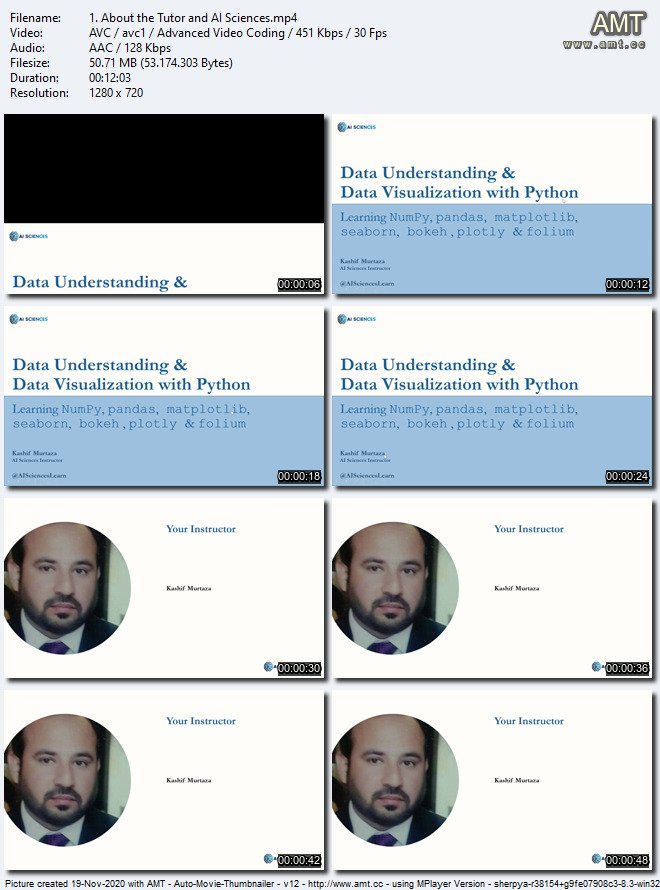
 MP4 | Video: h264, 1280×720 | Audio: AAC, 44.1 KHz, 2 Ch
Genre: eLearning | Language: English + .srt | Duration: 81 lectures (12h 27m) | Size: 3.31 GB
Learn NumPy for Data Processing , Pandas for Data Manipulation and Visualize using Matplotlib, Seaborn and Bokeh
What you’ll learn:
The importance of data manipulation and visualization in Data Science
How to manage text data with strings
The basics of Data Structures in Python
CRUD operations on Data Structures (Create, Retrieve, Update, Delete)
The importance of the NumPy package for Data Processing
How to build complicated applications like KNN with a few lines of codes in NumPy
The importance of the Pandas package for Data Manipulation and Data Understanding
Process Covid-19 Real Data file Using Pandas
The basics of visualization using Matplotlib
3D visualizations in Matplotlib
The importance of Seaborn
Interactive visualizations in Bokeh
3D interactive visualizations using Plotly
Surface and scatter 3D interactive plots in Plotly
Geographic mapping using Folium
Implement COVID-19 density over the globe
Plotting directly in Pandas
Requirements
Absolutely no prior knowledge or experience needed. You only need a passion to be successful!
You can be a beginner in Python, data visualization or data science, or you can be proficient in it.
Admin permissions to download files
Description
Are you ready to start your path to becoming a data manipulation and visualization expert?
Do you know nothing about data manipulation and visualization but want to know them well enough so that you can implement projects?
Are you worried that learning data manipulation and visualization is going to be tough?
Do you ever wonder if Data Scientists having a good understanding of data manipulation and visualization have a bright future?
Listen to what the most relevant people have to say:
“Data Science will automate jobs that most people thought could only be done by people.” ~ Dave Waters
“Just as electricity transformed almost everything 100 years ago, today, I actually have a hard time thinking of an industry that I don’t think Artificial Intelligence/Data Science will transform in the next several years.” ~Andrew Ng
“A breakthrough in Data Science would be worth ten Microsofts.” ~ Bill Gates
Data is, without a doubt, the new electricity. Over the next several years, data is going to transform everything. And guess what? Data manipulation and visualization skills are at the core of Data Science.
There are lots of courses and lectures out there regarding data manipulation and visualization. But this course is different!
This course follows a step-by-step and straightforward methodology. In every new tutorial, you will build on what you have already learned and move one extra step forward. You are then assigned a small task that you solve at the beginning of the next video.
You start by first learning the theoretical part of a data visualization concept. Then, you implement everything practically, using Python. We are using Python as a programming language because it has a lot of demand in the market. Plus, it is a super easy and efficient language. Python is the hottest programming language nowadays if we talk about machine learning or data science, and thus for data manipulation and visualization.
You don’t need to worry if you don’t know Python. We have a course for absolute beginners on our channel as well. And by the way, you need not know a lot of Python for this course. You will explore packages and will rely mostly on one-liners as compared to lengthy codes.
You will also implement a lot of mini-projects in live coding sessions in which you will gain a complete look and feel on how to implement modules in data manipulation and visualization.
With over 12 hours of HD video lectures divided into 75+ small videos and detailed code notebooks for every lecture, this is one of the most comprehensive courses for data manipulation and visualization on Udemy!
You’ll not only learn how to solve problems in data manipulation and visualization, but you will also be equipped with the right tools in your hand!
Here are just a few of the topics that you will be learning:
Introduction to Data Structures
Importance of NumPy
How Pandas efficiently processes large data files
Data Preparation
Visualizations using multiple packages
Interactive visualizations using multiple packages
Process Covid-19 real data file using Pandas
Geographic data mapping
Plotting directly from Pandas
and much, much more!
Enroll in this course and become a data manipulation and visualization expert today!
Who this course is for
This course is for you if you know nothing about data manipulation and visualization.
This course is for you if a step-by-step and straightforward methodology of teaching appeals to you.
This course is for you if you want to learn data manipulation and visualization practically.
This course is for you if you want to learn data manipulation and visualization right from the beginning.
This course is for you if you want to implement a lot of mini projects in live coding sessions.
● This course is for you if you are curious to learn about the theory of data manipulation and visualization and then implement it in real-world projects.

Password/解压密码0daydown
Download rapidgator
https://rg.to/file/8f8950c2c311b46cfa75e7b1863f3823/Data_Understanding_and_Data_Visualization_with_Python.part1.rar.html
https://rg.to/file/d78d2f05254fffc7272bfeb382c45af2/Data_Understanding_and_Data_Visualization_with_Python.part2.rar.html
https://rg.to/file/887d65e2b5b090e9bb8e070931ace2a9/Data_Understanding_and_Data_Visualization_with_Python.part3.rar.html
https://rg.to/file/01d0ff7e5f680528f8e9d114af26e377/Data_Understanding_and_Data_Visualization_with_Python.part4.rar.html
Download nitroflare
https://nitroflare.com/view/BCDE56835682062/Data_Understanding_and_Data_Visualization_with_Python.part1.rar
https://nitroflare.com/view/4E810911E161200/Data_Understanding_and_Data_Visualization_with_Python.part2.rar
https://nitroflare.com/view/B173814F10B8FE1/Data_Understanding_and_Data_Visualization_with_Python.part3.rar
https://nitroflare.com/view/885322E9D902E80/Data_Understanding_and_Data_Visualization_with_Python.part4.rar
转载请注明:0daytown » Data Understanding and Data Visualization with Python