MP4 | Video: h264, 1280×720 | Audio: AAC, 44.1 KHz, 2 Ch
Genre: eLearning | Language: English | Duration: 50 lectures (2h 39m) | Size: 1.77 GB
Simple and quickly implementable examples with Leaflet based on Javascript
What you’ll learn:
Leaflet plugins like Heatmap and Cluster
GPX, SHP and Geojson data implementation
Simple practical examples with Leaflet and OpenData-Austria visualization
Data Visualization
Requirements
Basic knowledge in JavaScript, Xampp (=free local server) or web server
Description
After a brief general unit on leaflet, we start programming. We use real data from Austria based on OpenData and look at the most important file formats.
Suitable for beginners and even professionals can take a lot from the course.
In this course you will learn about the following data and file formats and visualize them yourself:
Mountain bike routes in GPX format
Ozone valuesin Austria – in JSONp format
Mountain huts in SHP format
Nature reserves in SHP format
We will use some Lefalet plugins in training – for example:
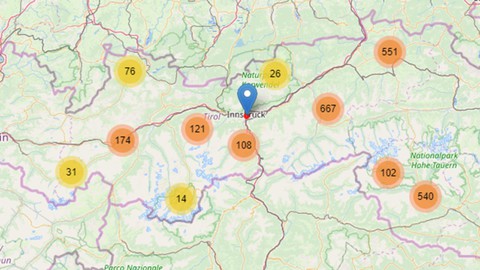
We cluster a few thousand data points
Ozone values are underlaid with a heat map
Course structure:
The videos are kept short (2-5 minutes)
After each video there is a save of all project data for download
It can be started with my proofed project files after each lesson
Guaranteed frustration-free learning without the hassle of troubleshooting and debugging
I use only open source software for this course :
XAMPP Apache Server
Notepad++ for coding
OpenData for the data sources
After this course you are able to implement your own Geo-Data into an Open-Street-Map with Leaflet. You can visualize your GPX-Tracks and also cluster them for an better overview. The oportunities are endless.
I look forward to your results and seeing you in the online course.
Markus Edenhauser
Who this course is for
Web developers who want to learn data visualization with leaflet (open source)
Password/解压密码www.tbtos.com
转载请注明:0daytown » Leaflet practice-oriented data visualization with JS