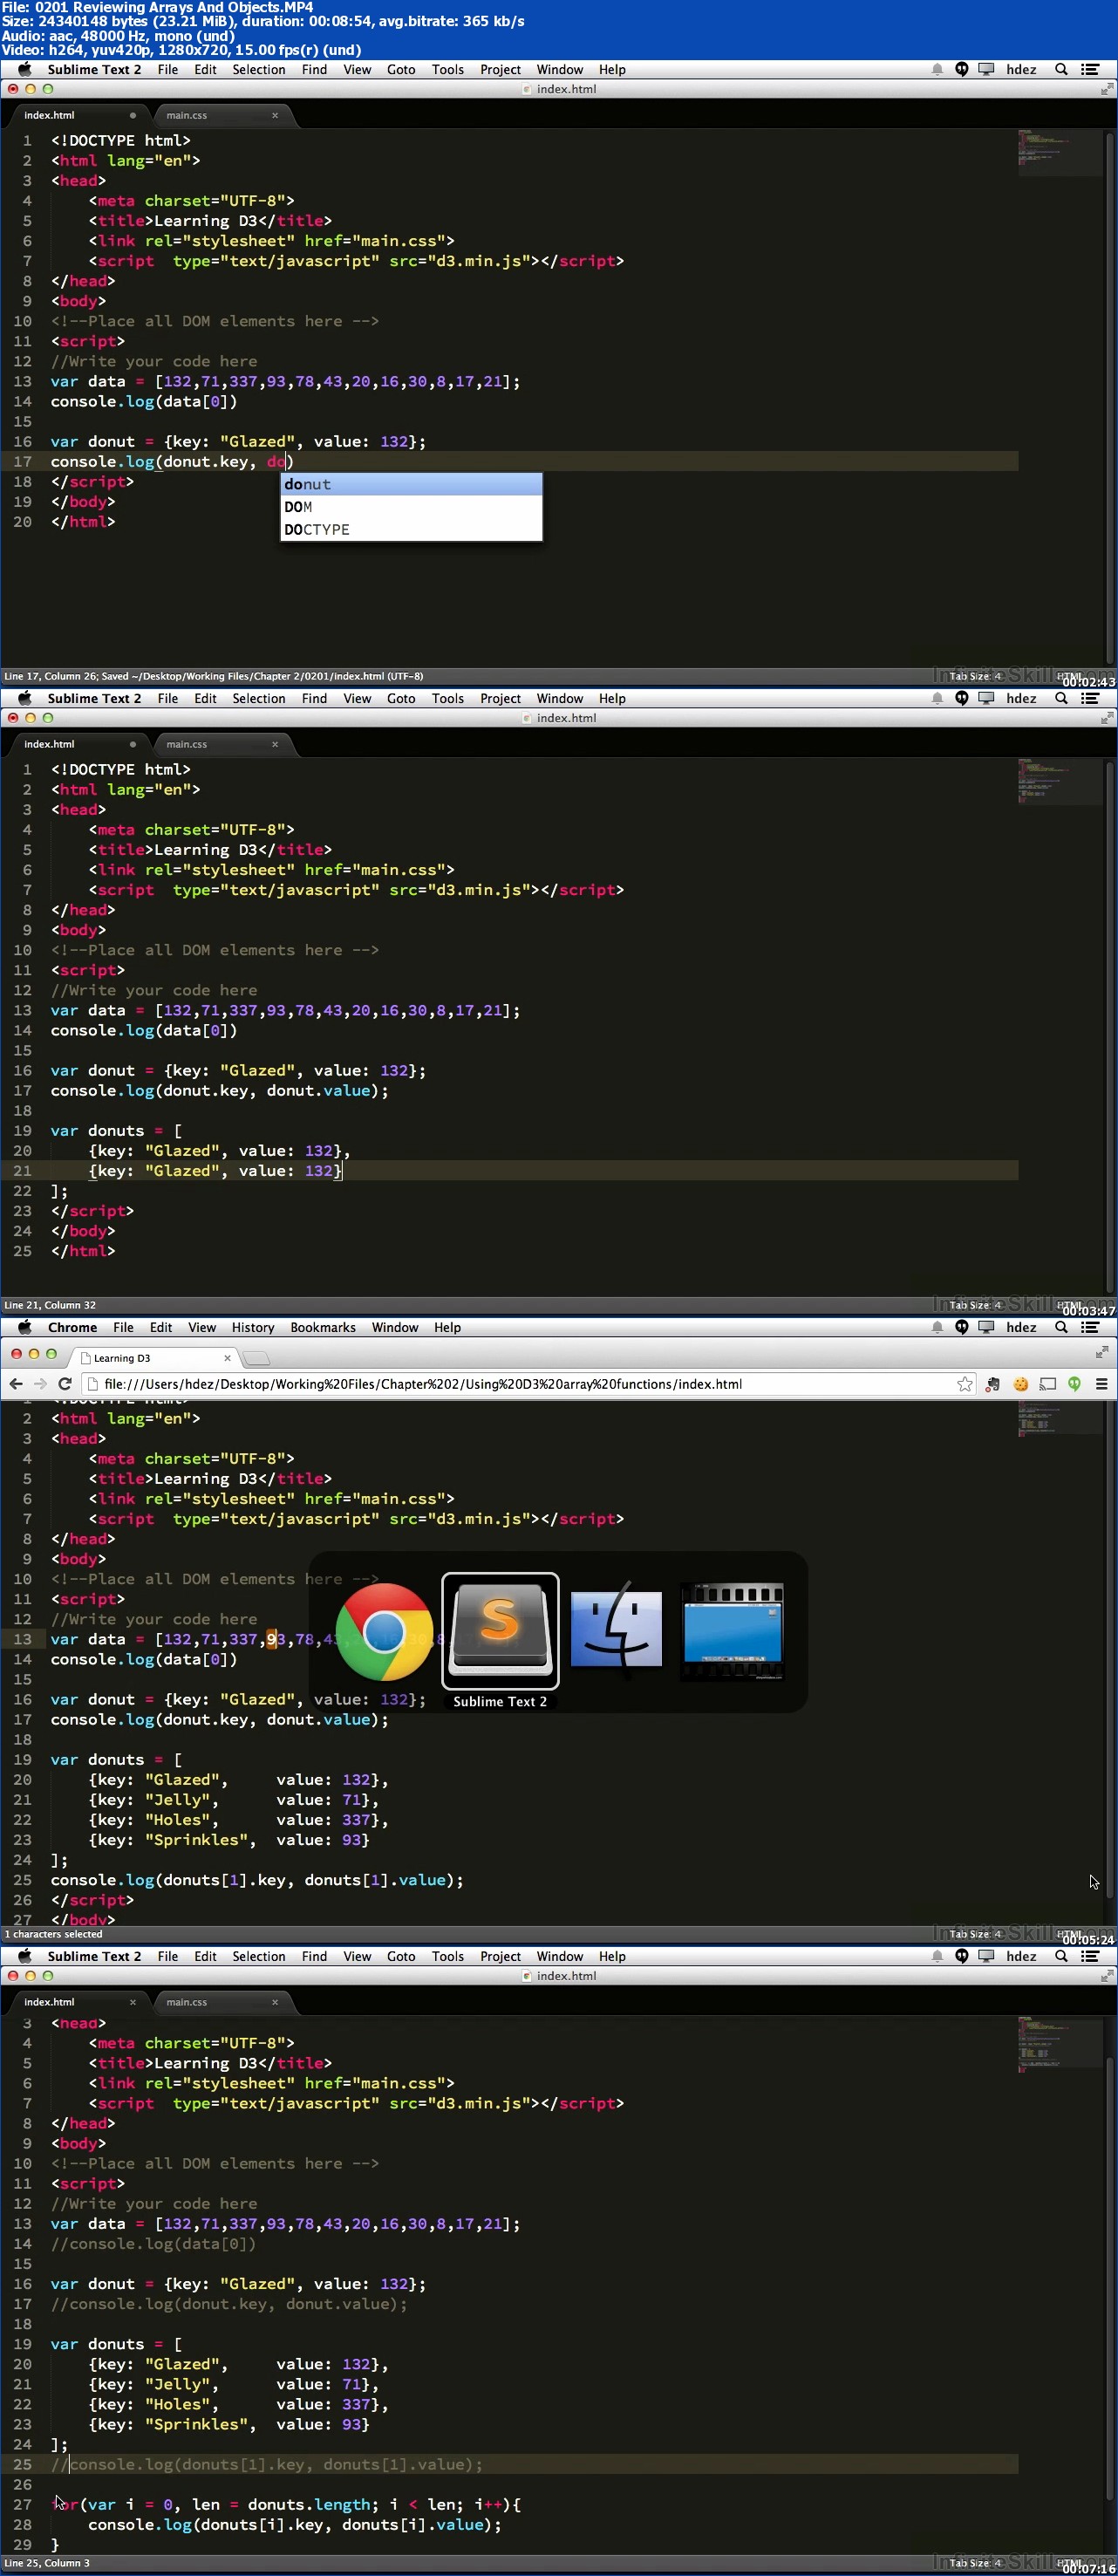
InfiniteSkills – Learning to Visualize Data with D3.js Training Video
Genre: E-learning
In this Learning to Visualize Data with D3.js training course, expert author Rafael Hernandez teaches you how to build data visualizations with the D3 JavaScript library. This course is designed for users that already have some HTML, CSS, and JavaScript programming experience.
You will start by learning the basics of D3, including how to bind data from JavaScript arrays to elements, scale data, and style simple data visualizations with CSS. From there, Rafael will show you how to introduce interactivity into your data visualization, including how to add a sort button, animate changes, and respond to other mouse events. This video tutorial will also cover how to create a line chart and a scatter-plot data visualization.
Once you have completed this computer based training course, you will have developed a solid working knowledge of D3, and be able to build your own data visualizations. Working files are included, allowing you to follow along with the author throughout the lessons.
http://www.iiiup.com/5P1/Learning-to-Visualize-Data-with-D3.js.part1.rar
http://www.iiiup.com/5P2/Learning-to-Visualize-Data-with-D3.js.part2.rar
http://www.iiiup.com/5P3/Learning-to-Visualize-Data-with-D3.js.part3.rar
你是VIP 1个月(1 month)赞助会员,
转载请注明:0daytown » InfiniteSkills – Learning to Visualize Data with D3.js Training Video
与本文相关的文章
- Python 3 OOP: Master Python Object Oriented Programming
- Python for VLSI Engineer P2 : Understanding COCOTB
- Building Powerful AI Marketing Automation with OpenAI API
- Backend Systems Design
- AUTOSAR Application Software Layer Course (ASWL) | english
- Ultimate Lighting Course – In-Depth Tutorial
- Flutterflow: Le cours complet – Le no code iOS & Android
- Support Vector Machines in Python: SVM Concepts & Code
- Logistic Regression in Python
- RESTful API with Angular & Django: Learn CRUD & AUTH
- Machine Learning Primer with JS: Regression (Math + Code)
- Create Desktop Game For Beginner with Unity Engine & C#
