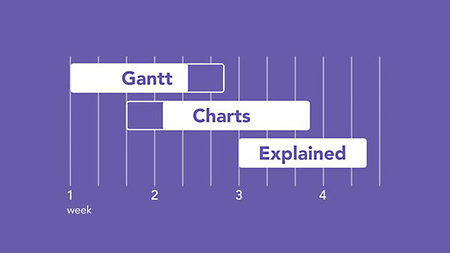
Lynda – Gantt Charts Explained
Size: 516MB | Duration: 1h 17m | Video: AVC (.mp4) 1280×720 30fps | Audio: AAC 48KHz 2ch
Genre: eLearning | Level: Appropriate for all | Language: English
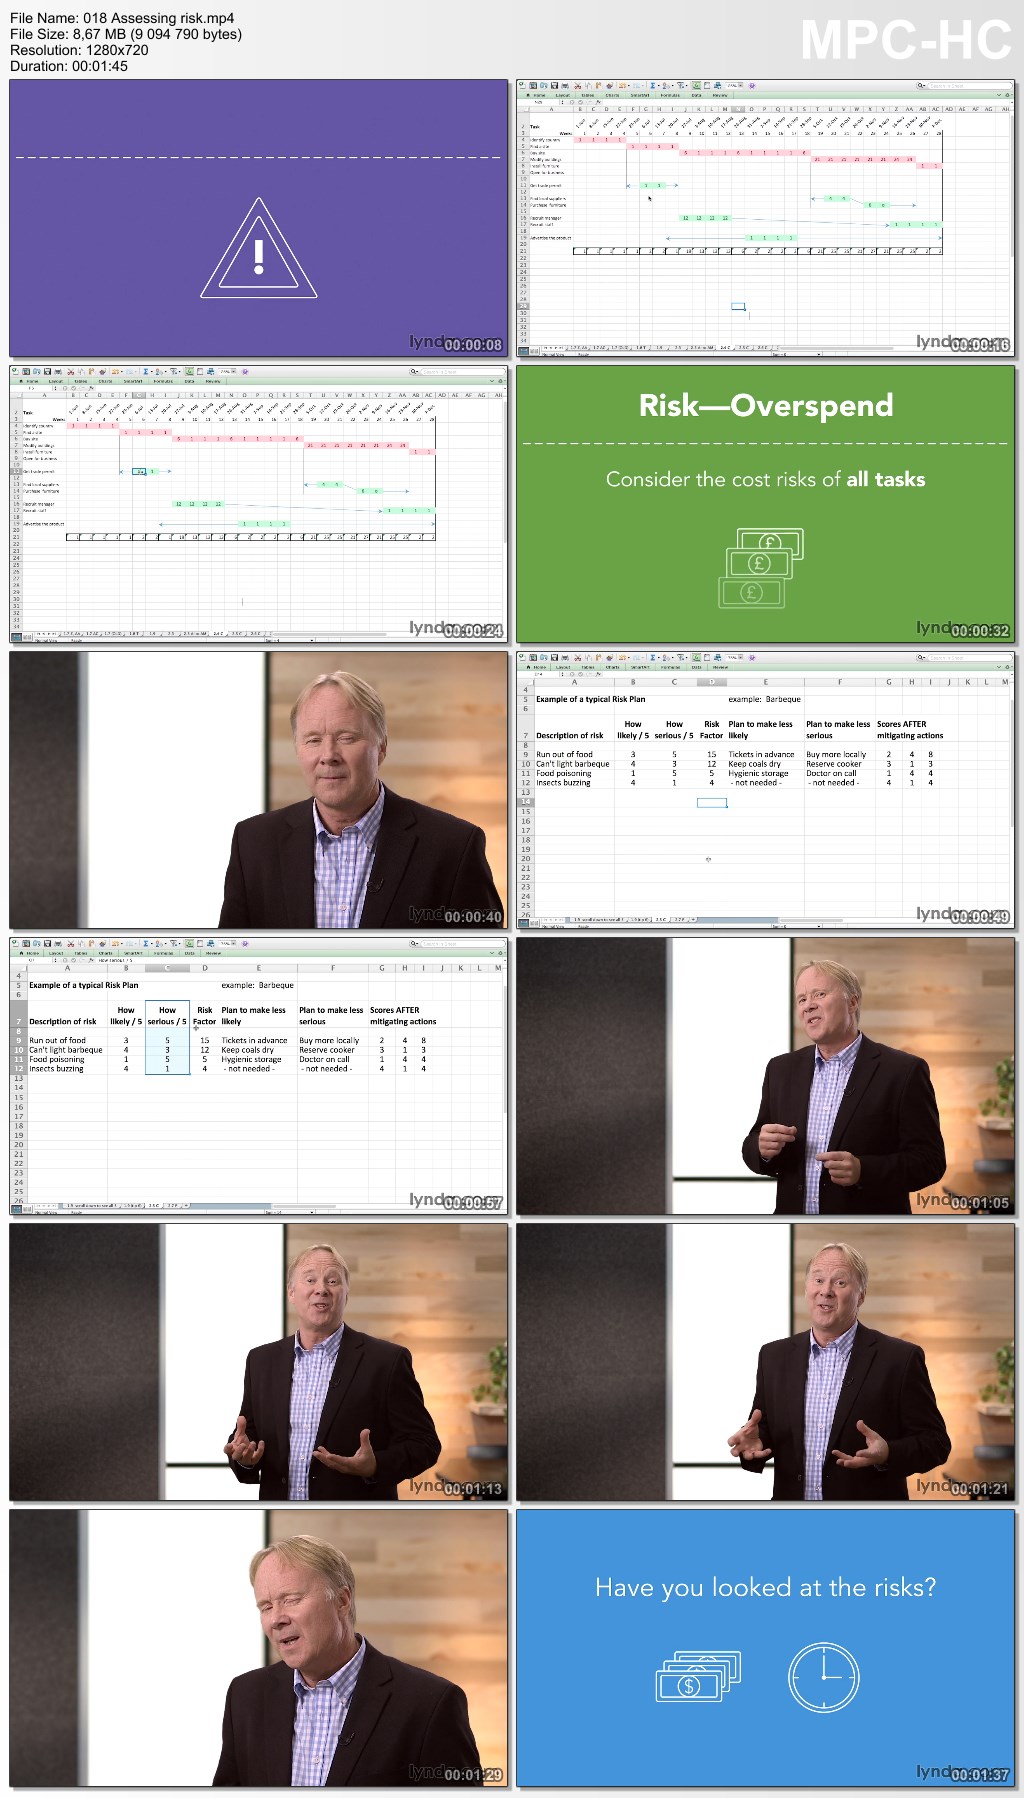
What is a Gantt chart? A Gantt chart is an incredibly helpful way to illustrate the critical deadlines associated with any project—connecting start and end dates of individual tasks and their interdependencies. In this course, project management trainer and Gantt chart aficionado Chris Croft explains how to create and use a Gantt chart for a variety of purposes, using different Gantt chart software. Learn how to create Gantt charts to communicate with customers, plan resources, monitor progress for one or multiple projects, assess risk, predict spend, and decide whether or not you can speed up your project. Chris also discusses the most common problems and provides tips to help you avoid mistakes.
Topics include:
* Estimating times and adding contingency
* Assessing the Gantt chart software options
* Using Gantt chart templates
* Communicating the plan
* Accelerating projects with Gantt charts

http://uploaded.net/file/noed07dr/LcGanttChartsExplained.part1.rar
http://uploaded.net/file/tpajnmoh/LcGanttChartsExplained.part2.rar
http://uploaded.net/file/q8a8nh6j/LcGanttChartsExplained.part3.rar
http://uploaded.net/file/0z462lbr/LcGanttChartsExplained.part4.rar
Download nitroflare
http://www.nitroflare.com/view/4EED59C54DD0EB0/LcGanttChartsExplained.part1.rar
http://www.nitroflare.com/view/A3C8ECEE0A16CE1/LcGanttChartsExplained.part2.rar
http://www.nitroflare.com/view/04708B0AB3D047A/LcGanttChartsExplained.part3.rar
http://www.nitroflare.com/view/FCD4431911B999F/LcGanttChartsExplained.part4.rar
你是VIP 1个月(1 month)赞助会员,
转载请注明:0daytown » Lynda – Gantt Charts Explained
与本文相关的文章
- Python 3 OOP: Master Python Object Oriented Programming
- Python for VLSI Engineer P2 : Understanding COCOTB
- Building Powerful AI Marketing Automation with OpenAI API
- Backend Systems Design
- AUTOSAR Application Software Layer Course (ASWL) | english
- Ultimate Lighting Course – In-Depth Tutorial
- Flutterflow: Le cours complet – Le no code iOS & Android
- Support Vector Machines in Python: SVM Concepts & Code
- Logistic Regression in Python
- RESTful API with Angular & Django: Learn CRUD & AUTH
- Machine Learning Primer with JS: Regression (Math + Code)
- Create Desktop Game For Beginner with Unity Engine & C#