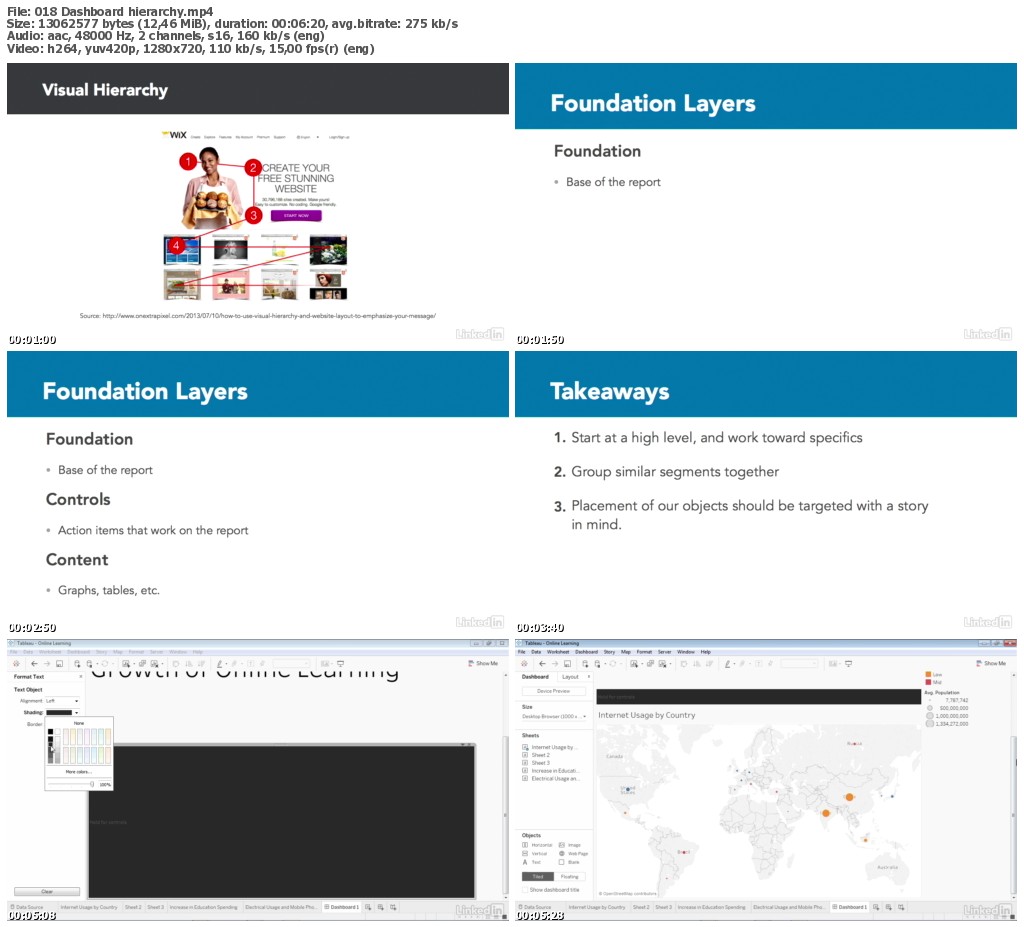
Lynda – Creating Interactive Dashboards in Tableau 10
Size: 391 MB | Duration: 2h 24m | Video: AVC (.mp4) 1280×720 15&30fps | Audio: AAC 48KHz 2ch
Genre: eLearning | Level: Intermediate | Language: English
Explore your data in new ways with interactive dashboards in Tableau. Dashboards act like dynamic reports that can be used for in-depth data analysis or to present information to clients. In this course, Nate Makdad shows you how to create them in Tableau 10, the latest version of the software. He shows how to build and format the worksheets that will feed your dashboard, design the dashboard itself, integrate analytics, and add interactive parameters that allow users to customize the display. Along the way, you’ll learn how to use some basic principles of visual design to make your dashboards easier to use and more visually appealing.
* Formatting data
* Creating cross-data joins
* Creating visuals
* Grouping data
* Using stories vs. tabs
* Changing chart measures and types with interactive parameters
* Making iterations and improvements on your Tableau dashboard design

http://uploaded.net/file/e8t8awvp/LcCr8IntrctDshbrdsTableau10.part1.rar
http://uploaded.net/file/mena9ney/LcCr8IntrctDshbrdsTableau10.part2.rar
http://uploaded.net/file/hgrejtd3/LcCr8IntrctDshbrdsTableau10.part3.rar
http://uploaded.net/file/ds1c7v8f/LcCr8IntrctDshbrdsTableau10.part4.rar
http://nitroflare.com/view/9AD1ECBA97FC267/LcCr8IntrctDshbrdsTableau10.part1.rar
http://nitroflare.com/view/D9E66057F0C82A1/LcCr8IntrctDshbrdsTableau10.part2.rar
http://nitroflare.com/view/8B173C676B3BDE6/LcCr8IntrctDshbrdsTableau10.part3.rar
http://nitroflare.com/view/E643BDC5621E75A/LcCr8IntrctDshbrdsTableau10.part4.rar
你是VIP 1个月(1 month)赞助会员,
转载请注明:0daytown » Lynda – Creating Interactive Dashboards in Tableau 10
与本文相关的文章
- Python 3 OOP: Master Python Object Oriented Programming
- Python for VLSI Engineer P2 : Understanding COCOTB
- Building Powerful AI Marketing Automation with OpenAI API
- Backend Systems Design
- AUTOSAR Application Software Layer Course (ASWL) | english
- Ultimate Lighting Course – In-Depth Tutorial
- Flutterflow: Le cours complet – Le no code iOS & Android
- Support Vector Machines in Python: SVM Concepts & Code
- Logistic Regression in Python
- RESTful API with Angular & Django: Learn CRUD & AUTH
- Machine Learning Primer with JS: Regression (Math + Code)
- Create Desktop Game For Beginner with Unity Engine & C#