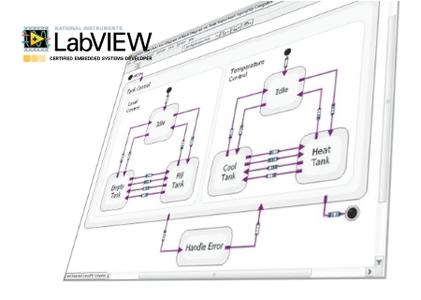
National Instruments (NI), has announced the release of LabVIEW 2018 Statechart Module. This Module provides a programming model that you can use to design applications at a higher level than was previously possible. With the Statechart Module, you can develop statechart diagrams, define behaviors with LabVIEW dataflow programming, and deploy the statecharts to desktop PCs, real-time controllers, field-programmable gate arrays (FPGAs), and embedded targets.
About LabVIEW Statechart Module. Simplify complex state-based applications with the NI LabVIEW Statechart Module. This LabVIEW add-on provides a high level of abstraction for designing applications using states, transitions, and events. With LabVIEW embedded technology, you can deploy applications built with statecharts using the LabVIEW Real-Time, LabVIEW FPGA, or LabVIEW Touch Panel Module or the LabVIEW C Generator.
Top Reasons to Use the LabVIEW Statechart Module
– Simple Semantics to Develop Software
The LabVIEW Statechart Module features high-level abstractions, such as states and transitions, to help you simplify complex software designs.
– Self-Documenting Programming
Statecharts are naturally self-documenting because software designs take a system-level view of the solution. Because of this, new developers can quickly grasp software designs and start contributing.
– Ability to Run on All NI Hardware Targets
You can run the LabVIEW Statechart Module on all NI hardware targets including desktop PCs, real-time systems, field-programmable gate arrays (FPGAs), and ARM microcontrollers. LabVIEW Statechart helps you easily port your code across architectures.
About NI LabView. LabVIEW (Laboratory Virtual Instrument Engineering Workbench) is a graphical programming language that uses icons instead of lines of text to create applications. In contrast to text-based programming languages that use instructions to determine the order of program execution, LabVIEW uses dataflow programming. In data flow programming, the flow of data through the nodes on the block diagram determines the execution order of the VIs and functions. VIs, or virtual instruments, are LabVIEW programs that imitate physical instruments.
In LabVIEW, you build a user interface by using a set of tools and objects. The user interface is known as the front panel. After you build the front panel, you add code using graphical representations of functions to control the front panel objects. You add this graphical code, also known as G code or block diagram code, to the block diagram. The block diagram somewhat resembles a flowchart. The block diagram, front panel, and graphical representations of code compose a VI.
About National Instruments. Since 1976, National Instruments has equipped engineers and scientists with tools that accelerate productivity, innovation and discovery. NI’s graphical system design approach to engineering provides an integrated software and hardware platform that speeds the development of any system needing measurement and control. The company’s long-term vision and focus on improving society through its technology supports the success of its customers, employees, suppliers and shareholders.
Product: LabVIEW Statechart Module
Version: 2018
Supported Architectures: x86
Website Home Page : http://www.ni.com
Language: english
System Requirements: PC
Supported Operating Systems: Windows 7even SP1/ 8.1 Update 1 / 10 (version 1709) / Server 2012 R2 or Server 2008 R2 SP1
Software Prerequisites: LabVIEW 2018 Base, Full, or Professional Development System
Size: 203.7 mb
Download rapidgator
https://rg.to/file/0839c07d19b6d4754a438477e40a67b2/bV18StateDul.rar.html
Download nitroflare
http://nitroflare.com/view/7632BB8D6A884C1/bV18StateDul.rar
Download 城通网盘
https://u7940988.ctfile.com/fs/7940988-294401397
Download 百度云
你是VIP 1个月(1 month)赞助会员,