MP4 | Video: AVC 1280×720 | Audio: AAC 44KHz 2ch | Duration: 2.5 Hours | 609 MB
Genre: eLearning | Language: English
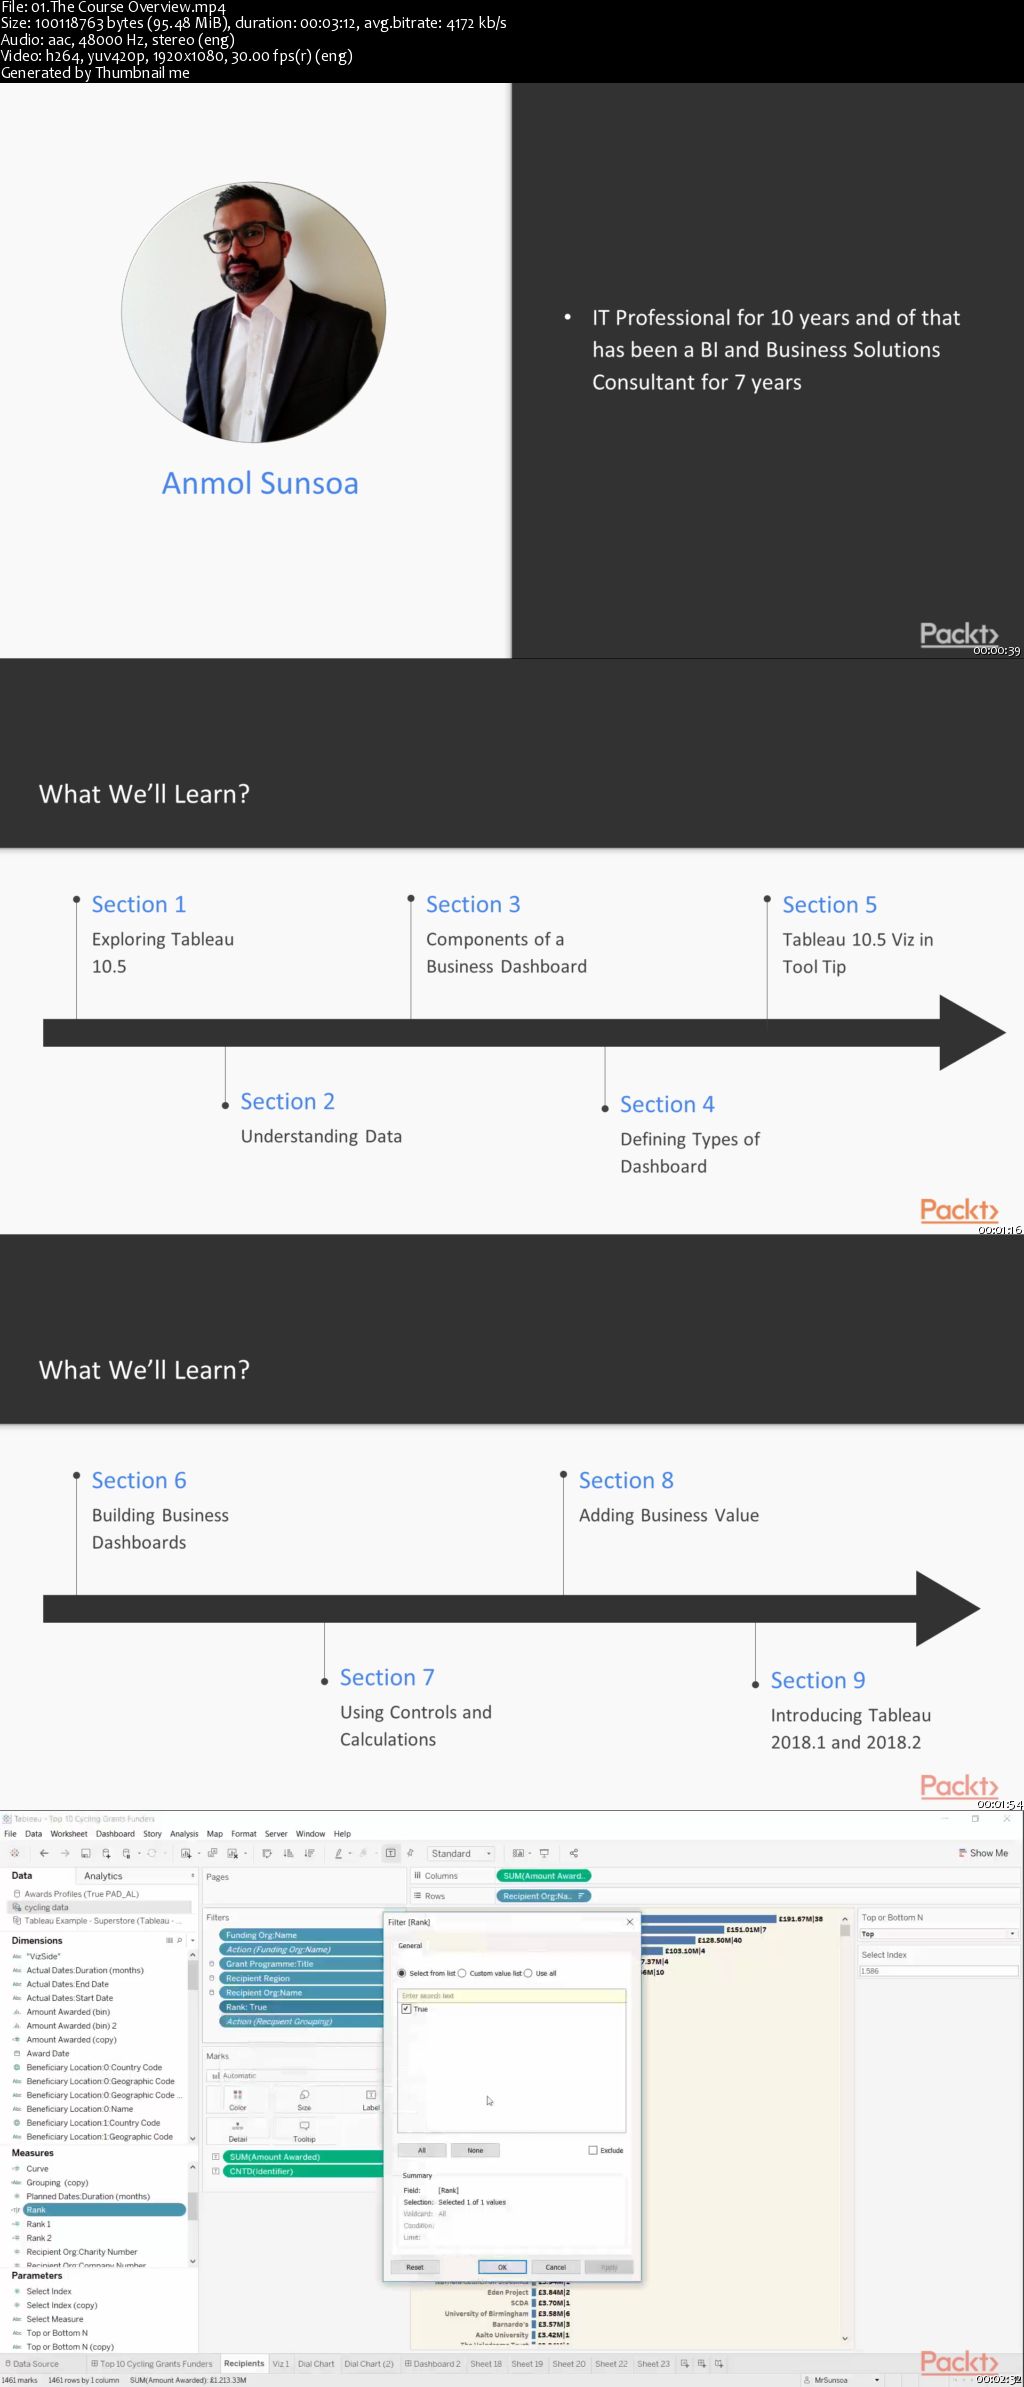
Tableau is part of a new class of business intelligence tools that dramatically reduce the time and technical acumen required to derive insights from data and publish them in a consumable format. You will lay the groundwork for building a successful dashboard and then move on to construct five different dashboards of increasing complexity.
Starting with exploring Tableau, you will see how to use its various features and create benchmarks. You will explore multiple approaches to building dashboards. You will use the top-down approach, which means creating a summary dashboard. Tactical dashboards are used by line managers to investigate issues that executives highlight from their executive dashboard by creating and interpreting waterfall, heatmap, and geographical charts, which provide insights to line managers. Using advanced techniques in Tableau, we’ll then show you how to use Analytical dashboards that can provide you with the tools to effectively extract knowledge from your data. We’ll also walk through quickly creating a visualization using ad-hoc dashboards that allow you to successfully keep an eye on a specific area of interest. Lastly, we’ll cover styling settings and publication options, and conclude with best practices.
This course guides you through the entire how and why of each task in the dashboard creation process, which will translate easily to your own dashboard projects.
All the code and supporting files for this course are available at: https://github.com/PacktPublishing/Building-Interactive-Dashboards-with-Tableau-10.5

Password/解压密码-0daydown
Download nitroflare
http://nitroflare.com/view/BB024FCC24ABE30/Building_Interactive_Dashboards_with_Tableau_10.5__Video_.part1.rar
http://nitroflare.com/view/8661274CC0FBB31/Building_Interactive_Dashboards_with_Tableau_10.5__Video_.part2.rar
Download 百度云
你是VIP 1个月(1 month)赞助会员,
转载请注明:0daytown » Building Interactive Dashboards with Tableau 10.5